1989issue C121-4
Evaluate mechanical systems by peak-to-trough drawdown
Common closed-trade statistics are not treated as sufficient to decide whether a mechanical commodity system can be traded. Maximum equity drawdown, measured as peak-to-trough-maximum-equity-drawdown, is the criterion used to judge tradability.
- Percent profitable, average win and loss, consecutive losers, hold times, and return on margin are not treated as sufficient to decide whether a mechanical commodity system can be traded.
- Maximum equity drawdown, not aggregate profit, is the criterion for tradability, and peak-to-trough-maximum-equity-drawdown is the stricter worst-case path.
- An annualized-closed-profit-to-drawdown-ratio under 2.00 is treated as unsuitable because a large drawdown between two flat stretches can leave a full year negative.
- Adding markets that do not move together can leave closed profits additive while lowering combined peak-to-trough drawdown, which raises the annualized ratio.
Closed-trade statistics do not decide tradability
Common closed-trade statistics such as percent profitable, average win and loss, consecutive losers, hold times, and return on margin are not treated as sufficient to decide whether a mechanical commodity system can be traded.
Maximum equity drawdown, not aggregate profit, is the criterion used to judge whether a commodity system is tradable. Tradability is whether a mechanical procedure can be held through its worst documented equity path without exhausting a stated starting account.
What a six-year historical test showed
In a six-year historical test, 47 of 60 mechanical systems that showed more than 1000000 after commissions and slippage still reduced a 100000 starting equity to zero at some point.
Use the stricter peak-to-trough path
Both close-to-close and later intraday-maximum-equity-drawdown are judged inadequate. Peak-to-trough-maximum-equity-drawdown is presented as the stricter worst-case path. It is measured from the highest open-equity peak in a trade sequence to the subsequent low, then extended whenever a later trough goes lower until a close exceeds the prior peak. The count starts from the furthest favorable open equity and continues to later troughs.
Depending on the system, the peak-to-trough measure exceeded the intraday-maximum-equity-drawdown by 8 percent to 32 percent because the count begins from a positive open-equity peak.
In the bar-by-bar illustration, the accumulated peak-to-trough path reaches 15 points after the first trade, 28 after the second, and 29 after the third, and a close 33 points above the last trough ends that sequence.
Compare systems with an annualized ratio
Systems are compared with an annualized-closed-profit-to-drawdown-ratio. That reading is cumulative closed-trade profit divided by peak-to-trough-maximum-equity-drawdown, then divided by the number of years in the test window. A reading under 2.00 is treated as unsuitable because a large drawdown between two flat stretches can leave a full year negative.
Add a market only if the path shrinks
Adding markets that do not move together can leave closed profits additive while lowering combined peak-to-trough drawdown, which raises the annualized-closed-profit-to-drawdown-ratio and is offered as a way to reduce portfolio drawdown. Portfolio-drawdown-diversification is that combination of markets that do not move together so combined peak-to-trough drawdown shrinks relative to additive closed profits.
Editorial interpretation: consider a second market only after the single-system peak-to-trough-maximum-equity-drawdown path already fits the hard limit, and only when the combined path shrinks.
Bound losses and study what fails
A mechanical commodity system is described as needing defensive stops that bound losses before and during the trade, with evaluation focused on what fails so the procedure can be improved.
Peak-to-trough equity path, three-trade example
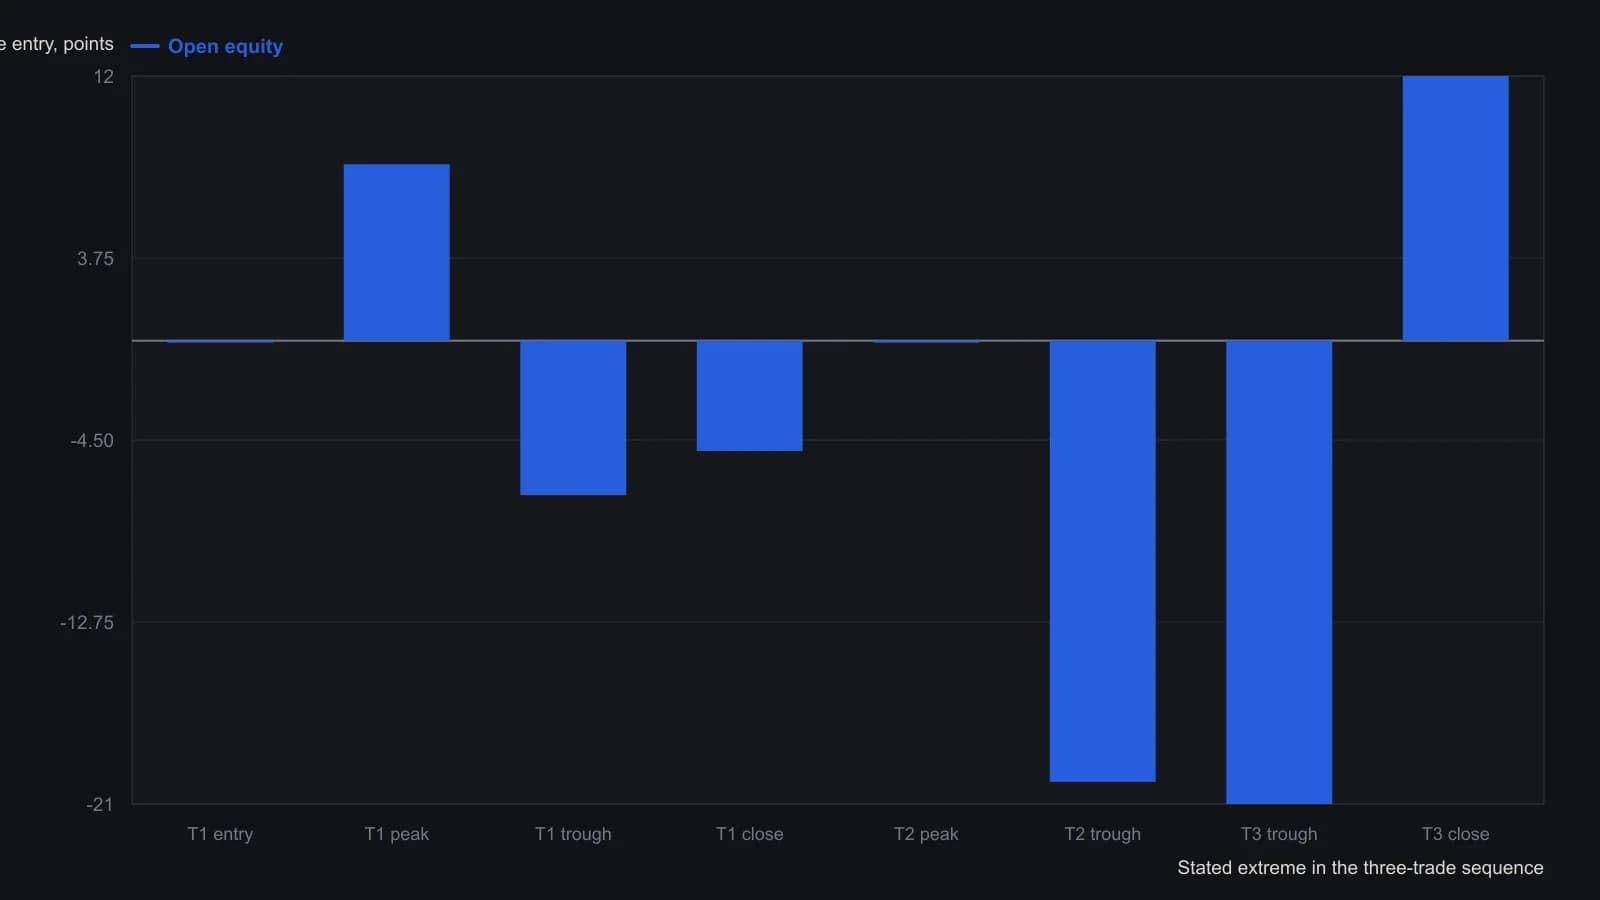
Trade 2's close and Trade 3's entry are omitted because the article does not state them. Peak-to-trough maximum equity drawdown is counted from the highest favorable open equity until a close exceeds that peak; Trade 3 closed 33 points above its low and ended this sequence. Each source bar is one closed trade, not a clock interval.
All readings on this track · 13 readings
- 1989Evaluate mechanical systems by peak-to-trough drawdown
- 1991Pairwise return covariance as a construction gate
- 1999Managed-futures construction from trend, leverage, and diversification
- 2000Treat a single name as a node on a correlation tree
- 2002Rising correlation undercuts foreign-listing diversification
- 2003A directional call is not the skill that keeps an account alive
- 2006Risk-adjusted return for cross-market trend systems
- 2010Iron condor range, volatility and diversification
- 2015Reverse diversification when one winner enters a quiet book
- 2016Rebuild the book when correlations and commentary flip
- 2017Idle screens and unused choice across markets
- 2018Professional trader skill as a staged operating system
- 2019Mechanical systems as a critique of discretion