2015issue C0444-47
A nine-sector sleeve drill on the business-cycle map
This archive article treats one sector ETF as a sleeve drill. The historical case placed nine industry ETFs on a four-phase business-cycle map, gave each sleeve a stated weight inside the equity mix, and judged the sleeve only after an overlay on its own sector index.
- The historical case partitioned a large-cap parent index into nine sector ETFs and paired each equity sleeve with a dedicated sector-index ticker.
- After the stocks-bonds-cash split, allocation ran again inside equities so each sleeve carried a stated profile weight.
- Sector rotation was framed as moving capital among industry groups because the business-cycle map assigns different sectors to different phases.
- A sleeve was judged by overlaying the sector ETF on its matching sector index or on the broad large-cap benchmark.
Nine equity sleeves from one parent index
The historical case partitioned a 500-stock large-cap parent index into nine sector ETFs. Each equity sleeve was paired with a dedicated sector-index ticker, so the nine tradable industry ETFs together made up the full parent index.
The business-cycle map and sector rotation
A four-phase business-cycle loop was used to show the nine sectors changing roles over time. The phases were full recession, early recovery, full recovery, and early recession.
Sector rotation was framed as moving capital from one industry group to another because the cycle map assigns different sectors to different phases. On one nine-sector relative-ranking snapshot, the energy sleeve ranked last.
A second allocation pass inside equities
After the usual stocks-bonds-cash split, the case applied allocation again inside equities. That inner mix combined domestic and foreign shares, income stocks, ETFs, and funds.
Quarterly weight tables listed each of the nine sleeves as a market-cap share of the parent index, and the nine shares always summed to the full index. The same tables supplied stepped allocation profiles from conservative to aggressive, so each sleeve carried a stated profile weight.
Index-proxy overlays
Sector strength was judged by overlaying a sector ETF on its own sector index or on a broad large-cap benchmark. In one overlay the consumer-staples and consumer-discretionary ETFs each sat above their matching indexes.
A large US bank stock plotted against its financial-sector ETF and financial-sector index showed wider swings than both proxies and sat below them on that chart.
Bank of America versus its financial-sector ETF and index
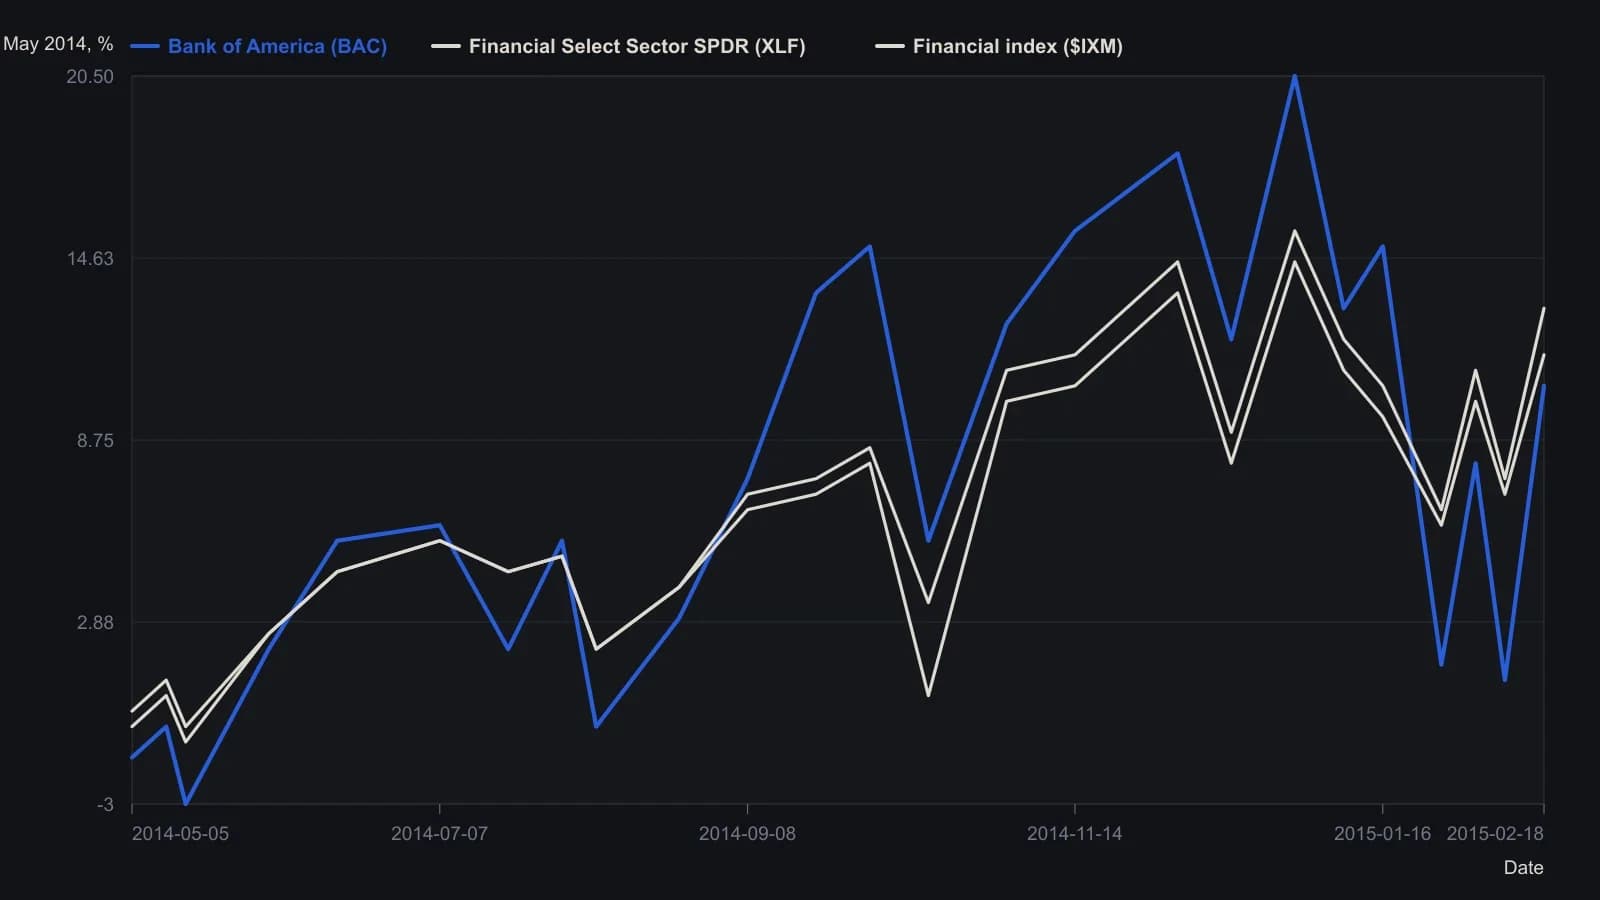
The source is a 200-trading-day percent-change chart from the first session, not a price chart. Turning-point dates were judged against monthly axis labels and y-values against 1 percent gridlines, so both are only reliable to about half a percentage point.
How one wrapper was taxed
A limited-partnership ETF wrapper in the case was described as taxed at a mix of the long-term capital-gains rate and the short-term rate, regardless of holding period.
All readings on this track · 10 readings
- 2001Constructing relative-strength ratios for spreads and rotation
- 2001Sector rotation, timing and leverage as a regime case study
- 2004Read one stock idea as a late-cycle puzzle
- 2004Always-on delayed-weak and live-strong sector sleeves
- 2012Building a sector-rotation histogram from rate-of-change spreads
- 2012Constructing a bull-bear sector rotation overlay
- 2012A relative-performance heatmap for pairs trading and sector rotation
- 2014Evaluating an annual contrarian sector rank-rotation
- 2014A ranking workflow that treated sector rotation as an abstention procedure
- 2015A nine-sector sleeve drill on the business-cycle map