2012issue C129-14
A relative-performance heatmap for pairs trading and sector rotation
A relative-performance heatmap plots the ratio of two price changes across many lookback lengths as a color field. The same readout can stay a paired long-short book when the names must remain correlated, or time a rotation from one sector or instrument into another when they need not.
- Pairs trading holds one correlated instrument long and the other short so a shared shock can offset across the two legs.
- A relative-performance heatmap plots the ratio of two price changes across many lookback lengths as a color field, used as a simpler alternative to watching a single correlation coefficient.
- When two stocks are hard to locate and short, the same readout can be applied to futures pairs, with contract counts scaled by point value.
- If the two names are not required to stay correlated, the same heatmap is treated as a timing tool for rotating from one sector or instrument into another.
What pairs trading holds
A pairs procedure simultaneously holds one correlated instrument long and the other short so that a shared shock can offset across the two legs. Profit in a pair is described as coming from a break in the usual co-movement, when the long side outperforms and the short side underperforms or rises less.
A color field instead of one coefficient
A relative-performance heatmap plots the ratio of two price changes across many lookback lengths as a color field, used as a simpler alternative to watching a single correlation coefficient.
Ford and General Motors
In the Ford-General Motors example, color at a mid-range lookback of 25 flipped long Ford and short GM on 15 March 2011 and reversed on 25 May 2011, with share counts chosen for similar dollar exposure. The same Ford-GM color flips produced five round-trips into early 2012, of which four were net profitable on the paired book.
Futures when stocks are hard to short
When locating and shorting two stocks is hard, the same relative-performance readout can be applied to futures pairs, with contract counts scaled by point value (two Nasdaq-100 minis versus one S&P 500 mini).
When correlation is not required
If the two names are not required to stay correlated, the same heatmap is treated as a timing tool for rotating from one sector or instrument into another rather than as a paired hedge. In a short AGZ-SPY rotation example, six of ten trades were winners and the tabulated net across those trades was 2956, described in the source as a profit factor over 5.
AGZ and SPY prices at heatmap rotation signals
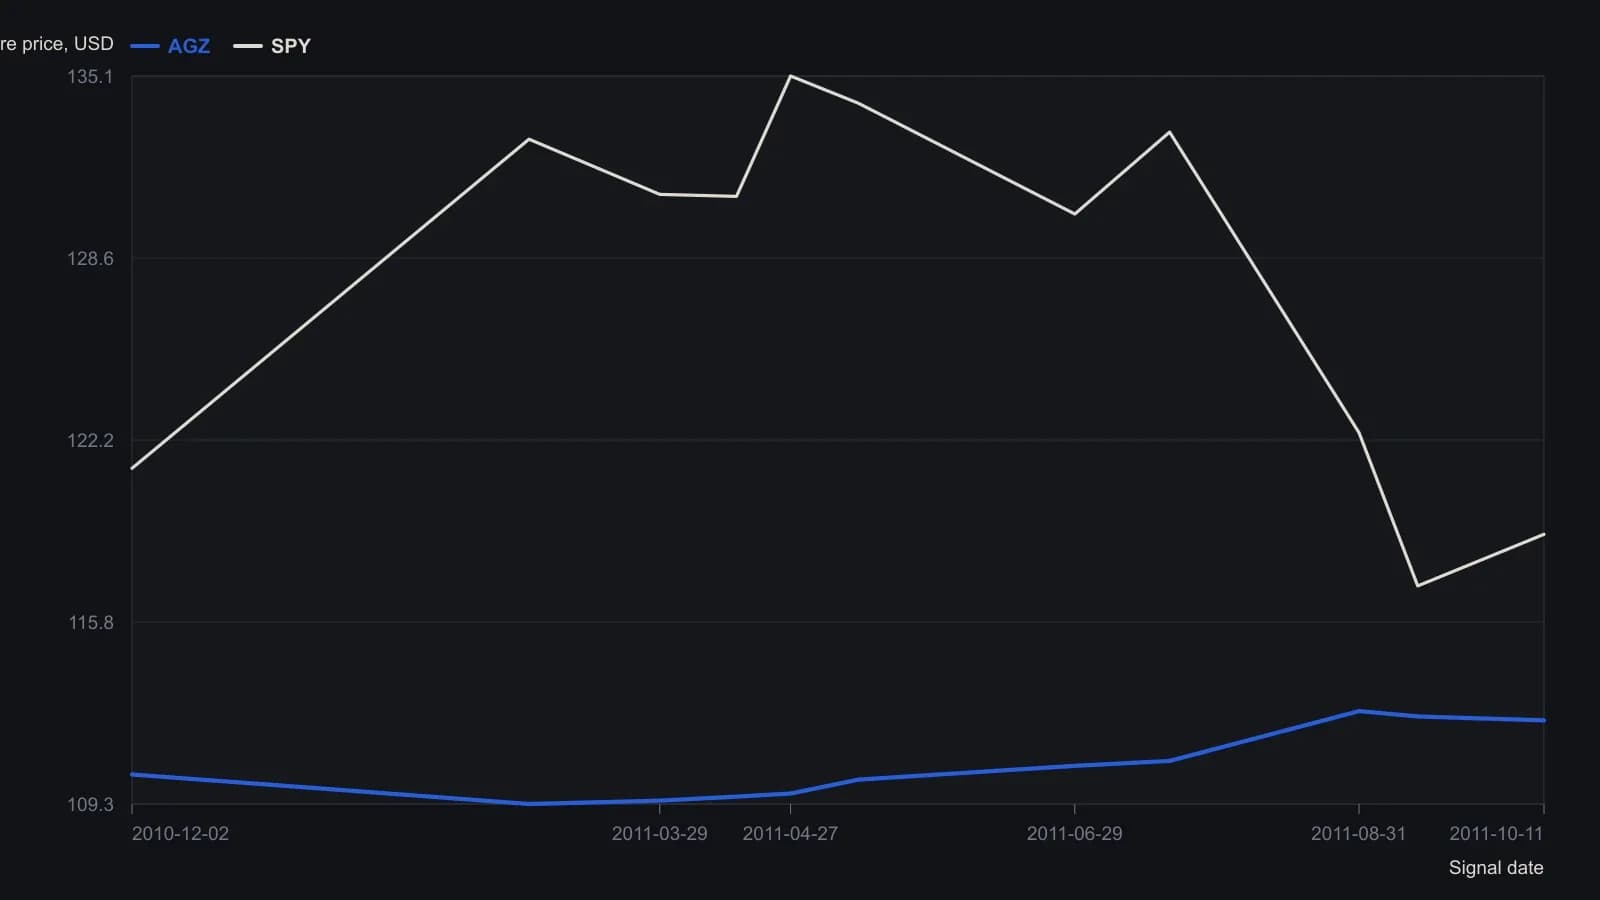
Trades were taken on the open after the 10-bar lookback (the white line on the heatmap) switched color through yellow, 100 shares on each side.
All readings on this track · 10 readings
- 2001Constructing relative-strength ratios for spreads and rotation
- 2001Sector rotation, timing and leverage as a regime case study
- 2004Read one stock idea as a late-cycle puzzle
- 2004Always-on delayed-weak and live-strong sector sleeves
- 2012Building a sector-rotation histogram from rate-of-change spreads
- 2012Constructing a bull-bear sector rotation overlay
- 2012A relative-performance heatmap for pairs trading and sector rotation
- 2014Evaluating an annual contrarian sector rank-rotation
- 2014A ranking workflow that treated sector rotation as an abstention procedure
- 2015A nine-sector sleeve drill on the business-cycle map