2014issue C0136-38
Evaluating an annual contrarian sector rank-rotation
A rank-rotation rule selects an equal-dollar sleeve of the three weakest sectors by prior-year percentage return from a nine-sector fund universe and uses a one-year calendar hold. The archive places that lagged-loser sleeve beside a same-universe winner sleeve, a broad-market proxy, and an annual equal-weight high-yield stock basket.
- The candidate universe is limited to nine sector funds covering materials, energy, industrial, financial, technology, consumer staples, utilities, health care, and consumer discretionary.
- The rank-rotation rule buys an equal-dollar sleeve of the three weakest sectors by prior-year percentage return and uses a one-year calendar hold before repeating the rank.
- The contrarian-strategy premise is that repeating business cycles can follow relatively weak sector years with relatively stronger ones.
- Evaluation comparators include a same-universe prior-year winner sleeve, a broad-market proxy, and the high-yield stock basket, read on yearly percentage returns that omit dividend reinvestment.
A fixed nine-sector universe
The candidate universe is limited to nine sector funds covering materials, energy, industrial, financial, technology, consumer staples, utilities, health care, and consumer discretionary.
Rank-rotation is an annual reordering of that fixed sector universe by prior-year percentage return, then holding a fixed-count sleeve for the next calendar year.
The rank-rotation rule buys equal dollar amounts of the three weakest sectors by prior-year percentage return and holds that equal-dollar sleeve for one year before repeating the rank. The calendar hold leaves the selected sleeve unchanged until the next rank.
The procedure is framed as a sector-rotation counterpart to an annual equal-weight high-yield stock basket. Sector-rotation here means shifting capital among market-sector funds instead of among a short list of individual company stocks, substituting sector funds for a small number of individual company names.
Starting sleeve and contrarian-strategy premise
Because the sector funds' first full calendar year is 1999, the evaluated rotation sequence begins in 2000 with financials, consumer staples, and utilities as the lagged-loser sleeve.
The contrarian-strategy selects the prior year's weakest sectors. The archive premise is that repeating business cycles can follow relatively weak sector years with relatively stronger ones.
Evaluation comparators
A same-universe opposite rule that instead holds the three prior-year winners is computed as an academic comparator. Evaluation places the lagged-loser sleeve beside a broad-market proxy, the high-yield stock basket, and that prior-year winner sleeve, including a $10,000 initial-capital growth path across those four tracks.
Reported yearly percentage returns for the compared procedures omit the effect of reinvesting dividends.
Calendar-year returns of the three-laggard sector sleeve versus comparators
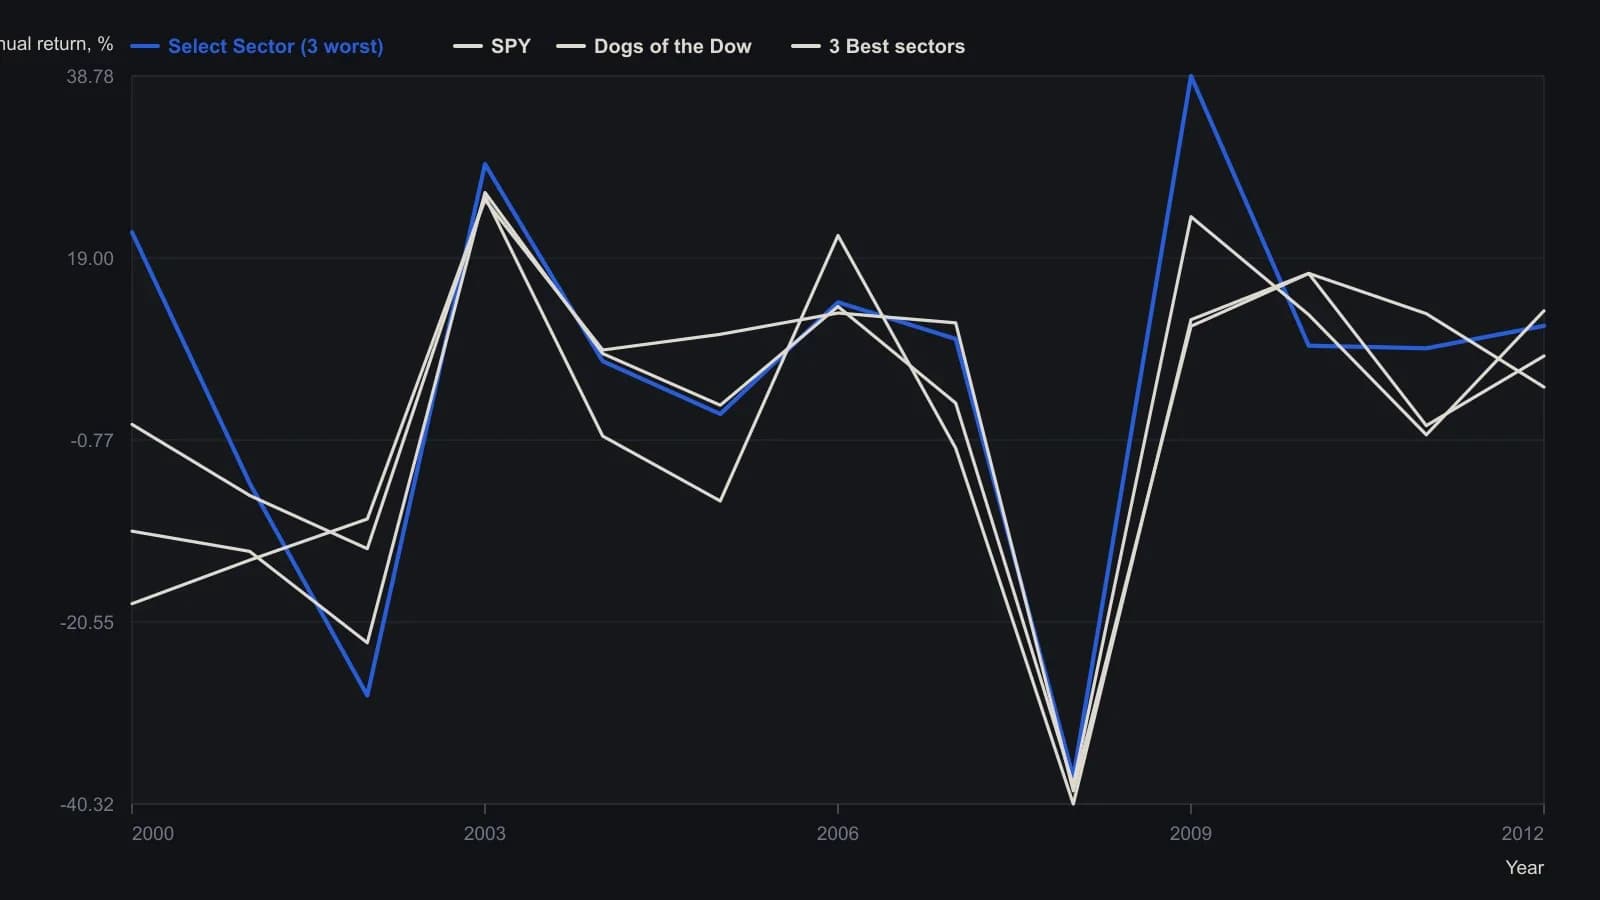
Yearly percentage returns do not include reinvested dividends. The nine Select Sector SPDRs’ first full calendar year was 1999, so the rank-rotation results begin in 2000 with a one-year hold.
All readings on this track · 10 readings
- 2001Constructing relative-strength ratios for spreads and rotation
- 2001Sector rotation, timing and leverage as a regime case study
- 2004Read one stock idea as a late-cycle puzzle
- 2004Always-on delayed-weak and live-strong sector sleeves
- 2012Building a sector-rotation histogram from rate-of-change spreads
- 2012Constructing a bull-bear sector rotation overlay
- 2012A relative-performance heatmap for pairs trading and sector rotation
- 2014Evaluating an annual contrarian sector rank-rotation
- 2014A ranking workflow that treated sector rotation as an abstention procedure
- 2015A nine-sector sleeve drill on the business-cycle map