2012issue C0878-79
Building a sector-rotation histogram from rate-of-change spreads
This archive construction locks one shared-lookback on every sector proxy, averages a two-name cyclical side against a three-name defensive side, and scales that spread into a histogram-overlay. Editorial note: read the bars as a regime frame for a single trade, not as a standalone trigger.
- Apply one shared-lookback to every sector proxy so each current close is compared with a close the same number of sessions back.
- The defensive-average is the mean of three close-to-lookback ratios on the energy, utilities, and consumer-staples proxies labeled XLE, XLU, and XLP.
- The sector-rotation-composite is 100 times the two-name cyclical-average minus the defensive-average, then drawn as a histogram-overlay on a daily chart.
- Editorial reading: use the histogram to sketch rotation forces around one trade rather than as a buy or sell trigger on its own.
Lock one lookback across the proxies
The archive walk-through builds a sector-rotation-composite from close-to-lookback ratios and places that reading beside price as a histogram-overlay.
Every sector proxy uses the same shared-lookback. When the custom function inputs are added, that length is set to 75, so each current close is compared with the close the same number of sessions earlier.
Average a cyclical side against a defensive side
The defensive-average is the mean of three close-to-lookback ratios on energy, utilities, and consumer-staples proxies labeled XLE, XLU, and XLP. That mean is the bear-side term.
The cyclical-average is the mean of two bull-side close-to-lookback ratios. The archive calls this two-name side a bullish composite. The finished sector-rotation-composite is 100 times that composite minus the defensive-average.
Draw the spread as a histogram overlay
After the custom function is saved, it is added to a daily chart and switched to a histogram appearance. The histogram-overlay lets the scaled cyclical-minus-defensive reading sit beside a price series.
A spreadsheet implementation of the same construction is shown as a 75-day rate-of-change visualization on a broad equity benchmark.
The write-up presents the indicator as a way to visualize rotation forces and suggests trying other available indexes as sector proxies.
S&P 500 with 75-day sector-rotation histogram
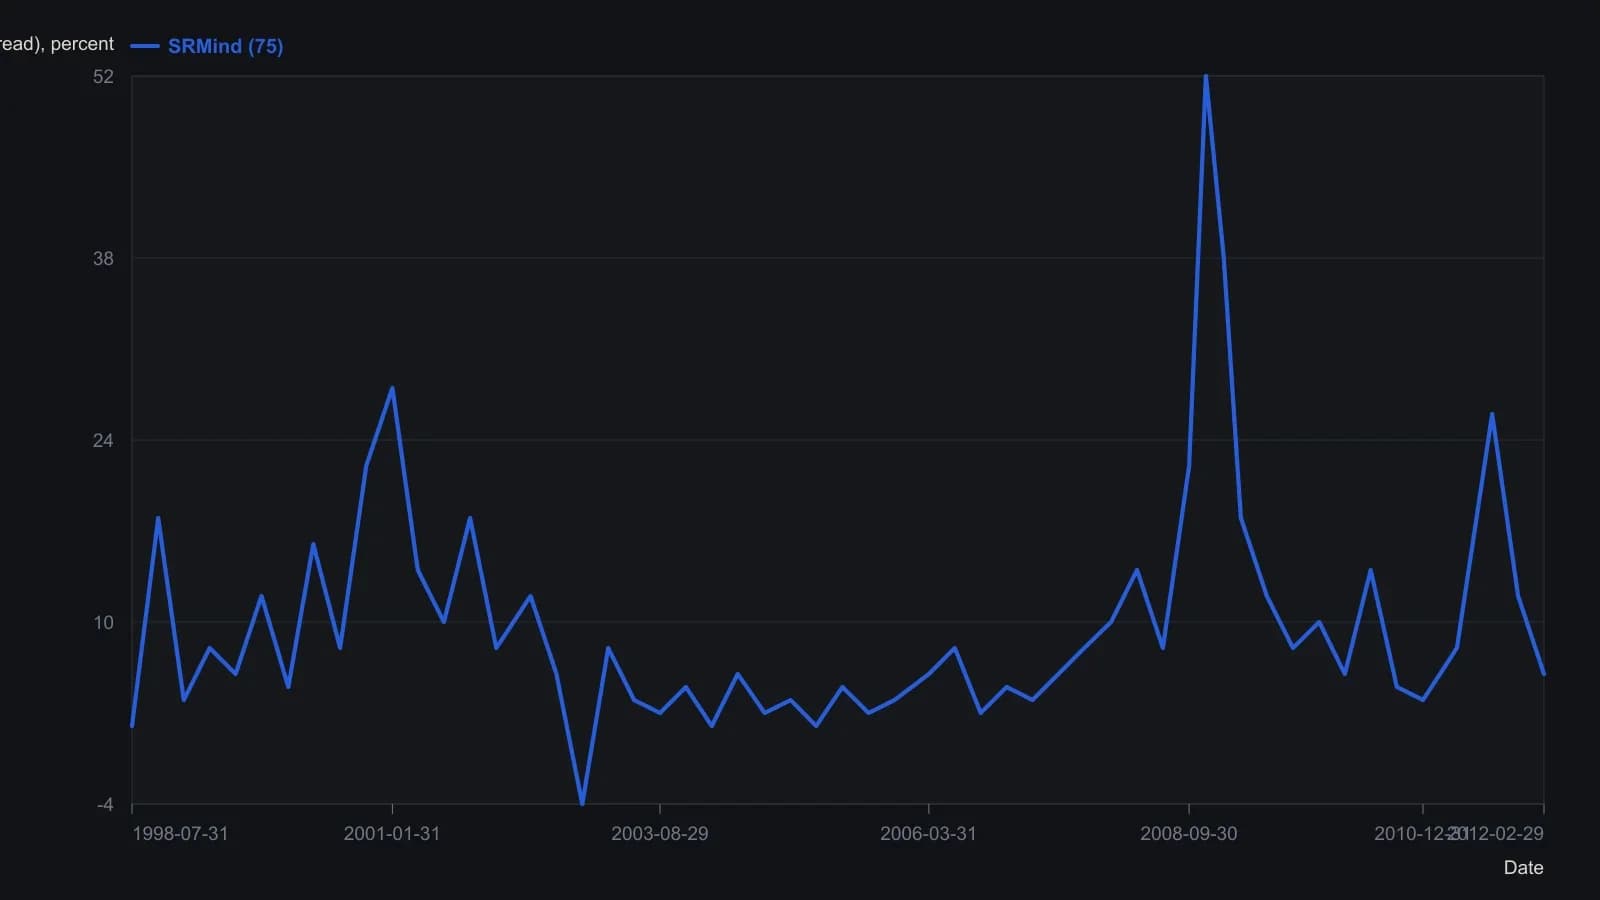
Lookback is fixed at 75 sessions as the tip instructs. Daily histogram bars were sampled at the printed date ticks plus the visible extremes; y-values are approximate to the labeled 20-point grid.
All readings on this track · 10 readings
- 2001Constructing relative-strength ratios for spreads and rotation
- 2001Sector rotation, timing and leverage as a regime case study
- 2004Read one stock idea as a late-cycle puzzle
- 2004Always-on delayed-weak and live-strong sector sleeves
- 2012Building a sector-rotation histogram from rate-of-change spreads
- 2012Constructing a bull-bear sector rotation overlay
- 2012A relative-performance heatmap for pairs trading and sector rotation
- 2014Evaluating an annual contrarian sector rank-rotation
- 2014A ranking workflow that treated sector rotation as an abstention procedure
- 2015A nine-sector sleeve drill on the business-cycle map