1990issue C101-3
When quiet-day breadth fails a horizon test
The Negative Volume Index updates market breadth only on quieter sessions. A later construction compares smoothed quiet-day breadth with all-day breadth, then a 10-year chi-square test asks whether unusual readings still carry the conventional sign.
- The Negative Volume Index is a cumulative advance-decline series that updates only on sessions when volume is lower than the prior session.
- A later construction applies a weekday-volume-correction, then contrasts 33 percent exponential averages of market breadth on declining-volume days with the same averages on all days.
- A 10-year chi-square test found a statistically notable association only at the six-month horizon, and that association ran opposite the conventional reading.
- Year-by-year tallies were unstable, and the write-up treated the results as a warning against accepting the construction on conceptual appeal alone.
A quiet-day running total
The Negative Volume Index is a market-breadth running total that updates only on sessions when volume is lower than the prior session, turning that quiet-day advance-decline residue into a directional signal.
The original rationale treats quieter sessions as the setting for professional positioning and high-volume sessions as the setting for public participation.
A later breadth comparison
A later construction first applies a weekday-volume-correction, a rescaling of daily volume so systematically quieter weekdays can be compared with the rest of the week, then applies 33 percent exponential averages to advances, declines, and total issues on declining-volume days and on all days.
Market breadth is used here as a comparison of advancing and declining issues, applied both on declining-volume days and across all days so the two streams can be contrasted. The published series compares those two smoothed market-breadth readings and then applies another 33 percent exponential average to the comparison.
Negative Volume Divergence Index, 1981–1990
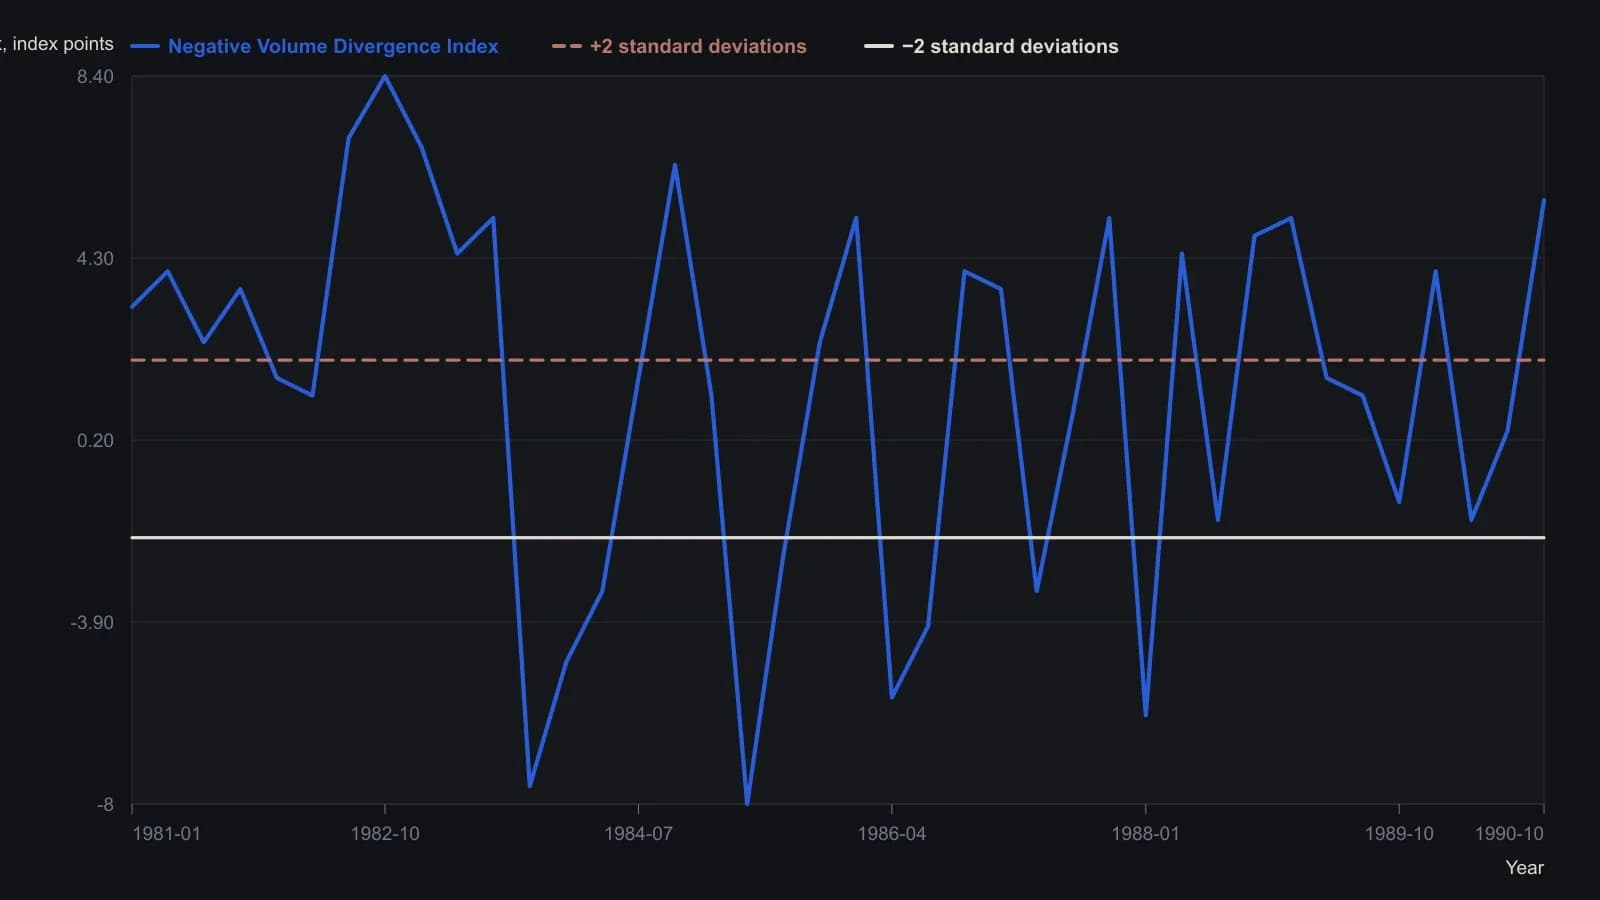
The plotted series is the 33% exponential of C, Merrill’s comparison of 33% exponentials of advances, declines and total issues on declining-volume days versus all days. Unusual-reading tests in the article used one standard deviation; the figure itself marks two-standard-deviation guides.
Unusual readings across five horizons
An unusual-reading is a threshold that labels an indicator value as high or low when it sits beyond one standard deviation of the series. A 10-year directional check asked whether unusually high or low readings, marked with a one-standard-deviation band, anticipated the industrial average at one-week, five-week, 13-week, 26-week, and one-year horizons.
A chi-square test is a categorical association check that asks whether unusually high or low indicator bins line up with later up or down moves of a price benchmark over a stated horizon.
The conventional sign inverts
A chi-square test found a statistically notable association only at the six-month horizon, and that association ran opposite the conventional reading: high figures lined up with later declines and low figures with later advances.
Year-by-year tallies were unstable, including 1985 with no correct directional calls against eight incorrect ones and 1988 with eight correct calls and none incorrect.
A warning about conceptual appeal
The write-up treated the modern results as consistent with a 1969 judgment that the series had begun to produce false signals and framed the exercise as a warning against accepting the construction on conceptual appeal alone.
All readings on this track · 9 readings
- 1986Volume confirmation, the negative volume index, and divergence
- 1990Constructing a signed-range negative volume line
- 1990When quiet-day breadth fails a horizon test
- 1994Stacking scored filters into a hierarchical stock outlook system
- 1996Constructing volume-split and advance-decline breadth signals
- 1996Constructing on-balance volume, volume-price analysis, and the negative volume index
- 1996Constructing volume disparity from percent-b
- 1996Constructing a price-volume percent-B disparity
- 2003Constructing a negative volume index as a moving-average regime test