2012issue C0420-27
Adaptive trend detection from dominant-cycle spectra
A tradable trend can be read as a longer cycle against a shorter one. Spectral-analysis of the dominant-cycle period then sets an adaptive-moving-average length that can be checked out of sample.
- A tradable trend can be framed as a longer-period wave relative to the cycle under review, so one series can show a shorter cycle inside a larger advance.
- A moving-average length chosen from history can still fail after market character changes, so a static period is not assumed to remain valid.
- An adaptive-moving-average takes half the measured dominant-cycle period and classifies trend-mode or cycle-mode from the instantaneous-trendline versus a short weighted-moving-average.
- Spectral-analysis can make cycle and trend measures more objective, but it does not forecast when one cycle will weaken and be replaced.
A trend as a longer cycle
A tradable trend can be framed as a longer cycle relative to the cycle being reviewed. On that reading, a weekly price series can show both a shorter cycle inside an advance and a larger cycle that later peaks.
Editorial note: TradersWeek uses this nesting as a teaching frame. The longer wave is still a cycle, only one that lasts long enough to identify and trade relative to the shorter cycle under review.
Nested cycles on a weekly chart
On the weekly S&P 500 chart from mid-2010 into 2011, a 14-week cycle was visible while price was trending from September through December 2010. The September 2010 to February 2011 advance was treated as part of a larger cycle that appeared to peak in mid-May 2011.
Why a static length can fail
A fixed-length moving average can track a trend closely, as an 18-bar weekly average did on the same S&P 500 example. Choosing that length from history favors stability measures such as average profit factor and standard deviation rather than maximum return.
A historically selected moving-average length can still fail after the market's character changes. A static period is not assumed to remain valid once conditions shift.
From dominant-cycle period to an adaptive average
An adaptive-moving-average can be built by measuring the dominant-cycle period and phase with spectral-analysis, feeding half that period into a simple moving average, and generating a signal from its crossover with a four-bar weighted-moving-average used to smooth price.
The spectrum analyzer used here is filter-based rather than Hilbert-transform-based. It accepts a frequency band from eight bars and above. Very long hypothetical cycles should not be compared with short ones solely because longer cycles carry more energy.
Trend-mode versus cycle-mode
The instantaneous-trendline is the cycle-aware trend estimate in this workflow. If it remains above or below the short weighted-moving-average regardless of cycle phase, the market is estimated to be in trend-mode. If it crosses that smoother, the market is estimated to be in cycle-mode.
S&P 500 weekly close versus the adaptive instantaneous trendline
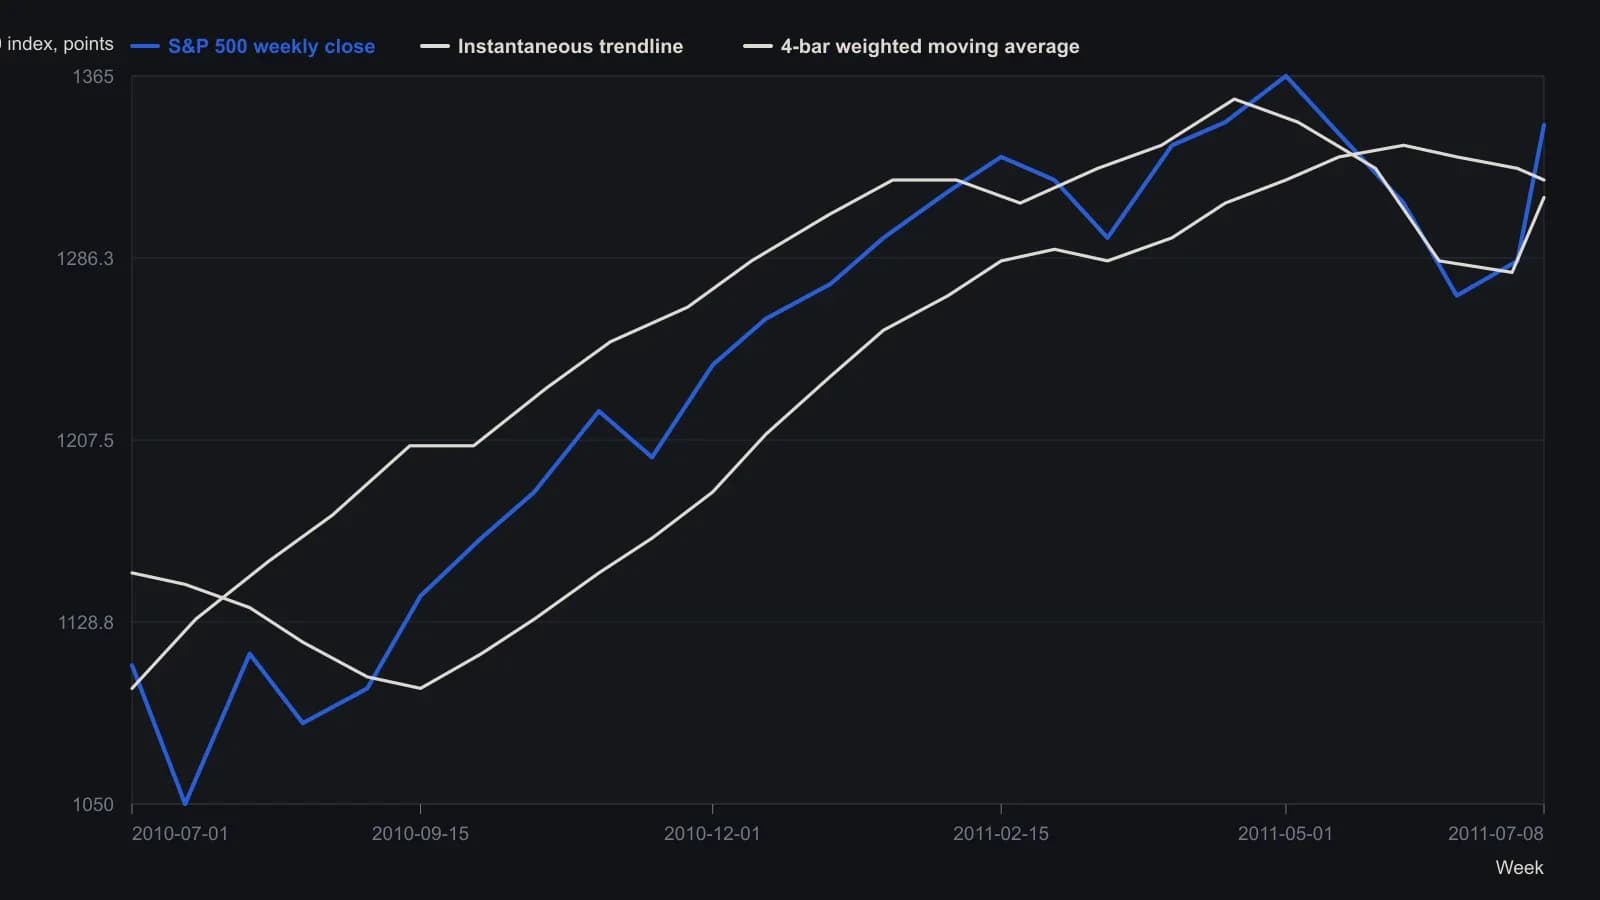
The instantaneous trendline uses half the dominant-cycle period from a spectrum-analyzer band of 8 to 23 weeks. Mid-sample levels are approximate to the raster; only the tagged end values are exact.
A daily reading and a longer wave
On a daily S&P 500 chart using a 10-to-39-bar band, the market was read as cycle-mode from March 2011. A 33.51-day dominant-cycle had phase 134.69 on July 14, 2011, implying about 12.6 days to a bottom near August 2, 2011. A 45.47-week cycle also pointed toward an early-August trough.
A stronger 18-month cycle was described as having just started declining. An early-August trough from the shorter cycles was not assumed to be the final low if that longer cycle remained dominant.
Observe, detect, and react
Discrete-time signal processing can make cycle and trend indicators more objective and adaptive. It does not forecast when one cycle will weaken and be replaced. The intended workflow is to observe, detect, and react.
Elliott-wave-like trajectories were noted as a possible complementary description rather than a completed hybrid system.
All readings on this track · 21 readings
- 1982Spectrum-first construction of moving-average trend filters
- 1990Crowd questions that switch cycle regimes
- 1993Antithetic twins to cancel origin-linked forecast bias
- 1994Constructing frequency response from a three-stage filter cascade
- 1994Bench-testing smoothers with cycle phase and power
- 1995Constructing minimum tradable cycles from spectral noise
- 1995Spectral whipsaw limits for a price-crossing average
- 1996Constructing market phase from dominant-cycle components
- 2000Constructing a Hilbert squelch dominant-cycle gate
- 2007When cycle mode fails: regime gates for spectral trades
- 2008Constructing singular-spectrum forecast baselines
- 2008Stacking a midband cycle gate on a short-memory trend filter
- 2011Engineering spectral cycle detection and moving-average harmony
- 2011Evaluating fixed oscillators against a moving dominant cycle
- 2011A construction checklist for a dominant-cycle sinewave
- 2012Assembling a market-mode heatmap from successive band-pass filters
- 2012Adaptive trend detection from dominant-cycle spectra
- 2015Constructing price paths from cycles and support
- 2018Oscillator distribution shape for mean-reversion filters
- 2020Constructing a cosine-correlation cycle and phasor trend filter
- 2020Constructing a correlation-cycle market-state engine