1996issue C111-5
Constructing market phase from dominant-cycle components
Once a dominant-cycle length is fixed, ordered prices are projected onto one-cycle sine and cosine weights to build phase. Later steps compare the observed phase-rate-of-change with the theoretical increment of that length, which is how trend-mode is classified and how a sine-wave-price-model can cross only while phase still advances.
- Phase is the angular location inside a 360-degree circuit and is built by correlating ordered prices over one dominant-cycle length with sine and cosine, then resolving the arctangent of the orthogonal-components.
- Trend-mode is not a second filter. It is the same construction when measured phase-rate-of-change stays below 67 percent of the theoretical increment of the dominant-cycle.
- The sine-wave-price-model plots the sine of measured phase beside the sine of that phase advanced by 45 degrees, and the pair can cross only while phase is still changing.
- When two spectral peaks are present at once, measured phase can stop advancing uniformly, and that stall is read as a shift from cycle-mode into trend-mode.
Phase sits on a 360-degree circuit
A completed cycle is treated as a 360-degree phase circuit, so a 10-bar cycle has a theoretical phase increment of 36 degrees per bar. Phase is the angular location inside that circuit, measured in degrees.
The phase routine requires a dominant-cycle length. That length is the one-period lookback for the sine and cosine correlations used to build phase. It may be a fixed swing count, a default of 15 bars, or a value remeasured on every bar. Spectral-analysis is the period-by-period strength display used to inspect or update the dominant-cycle length that the phase construction consumes.
Building phase from one dominant-cycle window
Dominant-cycle phase is constructed by correlating ordered prices over one full cycle length with sine and cosine. Those weights form the orthogonal-components: the real and imaginary sums over one dominant-cycle window.
Phase is then taken as the arctangent of the orthogonal-component ratio, after tangent-quadrant ambiguity is resolved. If the input series is a linear slope, the same one-cycle summation yields a phase of 180 degrees on an upslope and 0 degrees on a downslope.
Comparing observed and theoretical increment
Phase-rate-of-change is the bar-to-bar increment of measured phase, compared with the theoretical increment of 360 degrees divided by the dominant-cycle length. A near-zero observed phase increment, relative to that theoretical increment, is the construction used to flag trend-mode.
The supplied construction classifies a series as trend-mode when the measured phase-rate-of-change is less than 67 percent of the theoretical phase rate of the dominant-cycle. Cycle-mode is the complementary classification, in which measured phase advances near the theoretical dominant-cycle increment.
Two spectral peaks and the sine-wave-price-model
When two spectral peaks are present at once, measured phase can stop advancing uniformly, and the construction reads that stall as a shift from cycle-mode into trend-mode.
A sine-wave-price-model is a pair of traces equal to the sine of measured phase and the sine of that phase advanced by 45 degrees. The pair can cross only while phase is still changing.
Historical series illustration
On the September 1996 Treasury bond series, phase remaining near 0 degrees coincided with a February to March decline. Later uniform phase advance restored a sine-shaped overlay with successive crossings.
September 1996 Deutschemark daily futures price
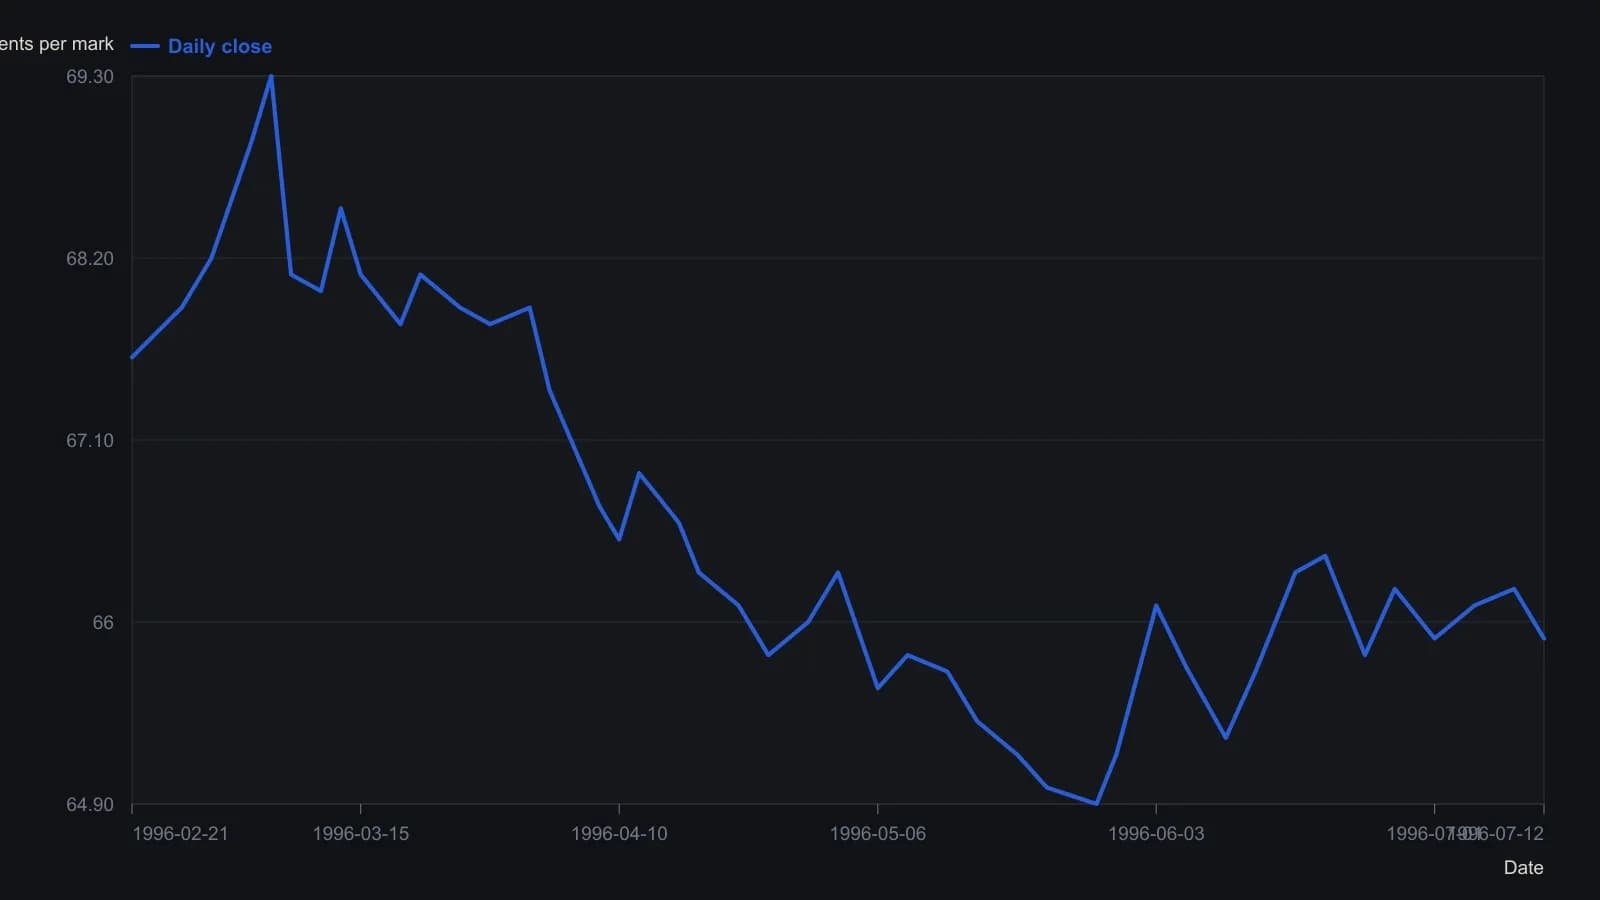
Closes other than 6 June 1996 are digitized from the raster and are only good to about a tenth of a point. The red MESA forecast beyond the last bar is omitted.
All readings on this track · 21 readings
- 1982Spectrum-first construction of moving-average trend filters
- 1990Crowd questions that switch cycle regimes
- 1993Antithetic twins to cancel origin-linked forecast bias
- 1994Constructing frequency response from a three-stage filter cascade
- 1994Bench-testing smoothers with cycle phase and power
- 1995Constructing minimum tradable cycles from spectral noise
- 1995Spectral whipsaw limits for a price-crossing average
- 1996Constructing market phase from dominant-cycle components
- 2000Constructing a Hilbert squelch dominant-cycle gate
- 2007When cycle mode fails: regime gates for spectral trades
- 2008Constructing singular-spectrum forecast baselines
- 2008Stacking a midband cycle gate on a short-memory trend filter
- 2011Engineering spectral cycle detection and moving-average harmony
- 2011Evaluating fixed oscillators against a moving dominant cycle
- 2011A construction checklist for a dominant-cycle sinewave
- 2012Assembling a market-mode heatmap from successive band-pass filters
- 2012Adaptive trend detection from dominant-cycle spectra
- 2015Constructing price paths from cycles and support
- 2018Oscillator distribution shape for mean-reversion filters
- 2020Constructing a cosine-correlation cycle and phasor trend filter
- 2020Constructing a correlation-cycle market-state engine