2011issue C0555-59
A construction checklist for a dominant-cycle sinewave
A sinewave forecast is assembled in order: detrend and measure the dominant cycle, build a 45-degree phase-lead overlay from that phase, and accept the construction only after a readiness-crossover inside the vigor and noise band.
- Detrend the series, then use spectral analysis to measure the dominant cycle so later work follows that period rather than a fixed lookback.
- Build the sine-wave price model from the measured phase and add a 45-degree phase-lead as the second line.
- Treat the overlay as ready only after a readiness-crossover while trend-vigor stays near the zero band and the signal-to-noise-ratio is not weak.
- A fixed-period-guess, especially in an oscillator, can produce misleading readings relative to the measured cycle.
Measure the dominant period first
Detrend the series before cycle measurement so the remaining oscillation can be inspected independently of the slow drift.
Spectral analysis ranks candidate cycle lengths by how much energy they carry. The dominant cycle is the strongest repeating period estimated from the ordered observations, and later indicators should follow that length rather than a fixed lookback.
The sampling interval is the bar size and lookback window that define the horizon of the cycle estimate and of any later forecast.
Build the phase-advanced overlay second
A sine-wave price model can be constructed directly from the phase of the measured dominant cycle rather than from a fixed lookback length.
The lead wave of that overlay is created by advancing the measured cycle phase by 45 degrees. That phase-lead keeps the model slightly ahead of the raw cycle rather than coincident with it.
Accept a forecast only after the readiness-crossover
A usable construction check looks for a crossover of the two sinewave lines while trend-vigor is roughly between +1 and -1 and the signal-to-noise-ratio is not weak.
That readiness-crossover is the construction gate: the sine and lead lines must cross, vigor must stay near the zero band, and the noise score must not be weak. Trend-vigor is a signed strength reading that asks whether the measured cycle is still oscillating or has been overtaken by a one-way move. A low signal-to-noise-ratio means the sine overlay should not be treated as a usable forecast.
Daily QQQQ sinewave with a 45-degree lead
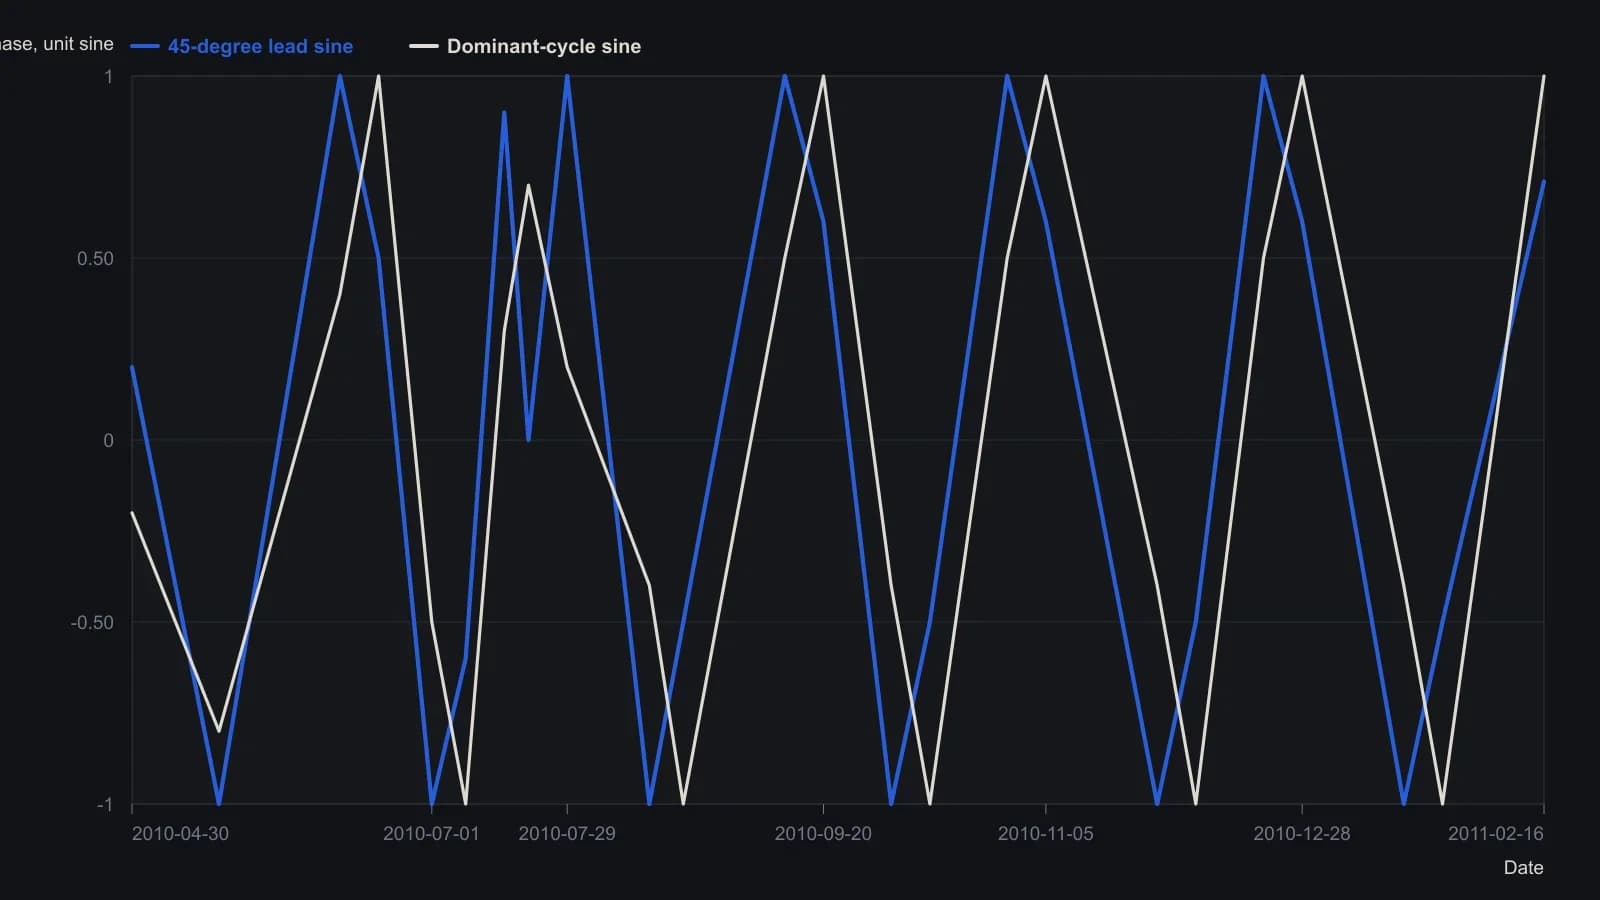
MESA9 plots a unit sine of measured dominant-cycle phase and a second plot of that phase plus 45 degrees. Peaks are taken at the pane's labeled 1.00 cap; troughs are the matching opposite swing on that unit-sine construction. Timing follows the July, October and 2011 axis marks. The mid-July notch is the irregular swing visible on the pane, not a smoothed cycle. Amplitude is recorded to one decimal; the raster does not support finer ticks.
A fixed-period-guess is not a measured length
Any indicator that still uses a fixed number of periods is only a guess at the true length implied by the current dominant cycle.
When that fixed-period indicator is an oscillator, the guessed length can produce misleading readings relative to the measured cycle.
Inspect the overlay and the gates together
The sinewave and trend-vigor pair can be assembled as stacked subcharts on a daily index series so the cycle overlay and the vigor/noise gates are inspected together.
All readings on this track · 21 readings
- 1982Spectrum-first construction of moving-average trend filters
- 1990Crowd questions that switch cycle regimes
- 1993Antithetic twins to cancel origin-linked forecast bias
- 1994Constructing frequency response from a three-stage filter cascade
- 1994Bench-testing smoothers with cycle phase and power
- 1995Constructing minimum tradable cycles from spectral noise
- 1995Spectral whipsaw limits for a price-crossing average
- 1996Constructing market phase from dominant-cycle components
- 2000Constructing a Hilbert squelch dominant-cycle gate
- 2007When cycle mode fails: regime gates for spectral trades
- 2008Constructing singular-spectrum forecast baselines
- 2008Stacking a midband cycle gate on a short-memory trend filter
- 2011Engineering spectral cycle detection and moving-average harmony
- 2011Evaluating fixed oscillators against a moving dominant cycle
- 2011A construction checklist for a dominant-cycle sinewave
- 2012Assembling a market-mode heatmap from successive band-pass filters
- 2012Adaptive trend detection from dominant-cycle spectra
- 2015Constructing price paths from cycles and support
- 2018Oscillator distribution shape for mean-reversion filters
- 2020Constructing a cosine-correlation cycle and phasor trend filter
- 2020Constructing a correlation-cycle market-state engine