1999issue C121-4
When markets burst, not trend
Calendar-year price progress in the archive sample is concentrated in a small share of net-extreme days. TradersWeek treats trend-following, a major-trend-average, and a volatility stop as one abstention-first procedure rather than as proof that prices trend on most sessions.
- Across the studied Standard & Poor's 500 calendar years from 1983 through 1998, an average of 32 trading days, or 12.88 percent of a roughly 250-day year, accounted for all net vertical price change.
- Burst-concentration is uneven from year to year: 1994 had seven net-extreme days and 1995 had 80, and Treasury bond and yen examples showed similar average shares of movement days near 12 percent and 13.7 percent.
- A major-trend-average of at least three to four months is used to guess burst direction, while a quiet-range-filter and a small-stop-edge keep a small account from entering when last week's range already exceeds last month's range.
- Editorially, these pieces should be tested as one trend-following procedure that includes abstention, not as evidence that markets trend on most days.
Most yearly movement sits in a few sessions
The archive sample treats calendar-year price progress as a sparse event process. What matters is the count of days that extend the year's net vertical path, not the impression that prices trend on a typical session.
Across the studied Standard & Poor's 500 calendar years from 1983 through 1998, an average of 32 trading days, or 12.88 percent of a roughly 250-day year, accounted for all net vertical price change. That share is burst-concentration: the portion of trading days that produce all of a market's net yearly vertical change, leaving most sessions without new extremes.
The sparsest year in that sample was 1994, with seven net-extreme days, or 2.8 percent of trading days. The densest was 1995, with 80 net-extreme days, or 32 percent. Treasury bond and yen examples showed similar burst-concentration, with average shares of movement days near 12 percent and 13.7 percent respectively.
How a net-extreme-day was counted
A net-extreme-day is a session that makes a new calendar-year high in an up year or a new calendar-year low in a down year. The study counted a net up day as a session that made a new calendar-year high and a net down day as a session that made a new calendar-year low, then expressed those counts as a percentage of about 250 trading days.
Calendar-year-direction is whether a market's year-end close is above or below its start-of-year close. That split is used to compare up years and down years across asset classes, not to claim that every session inside the year is a trend day.
S&P 500 net extreme days as a share of each calendar year
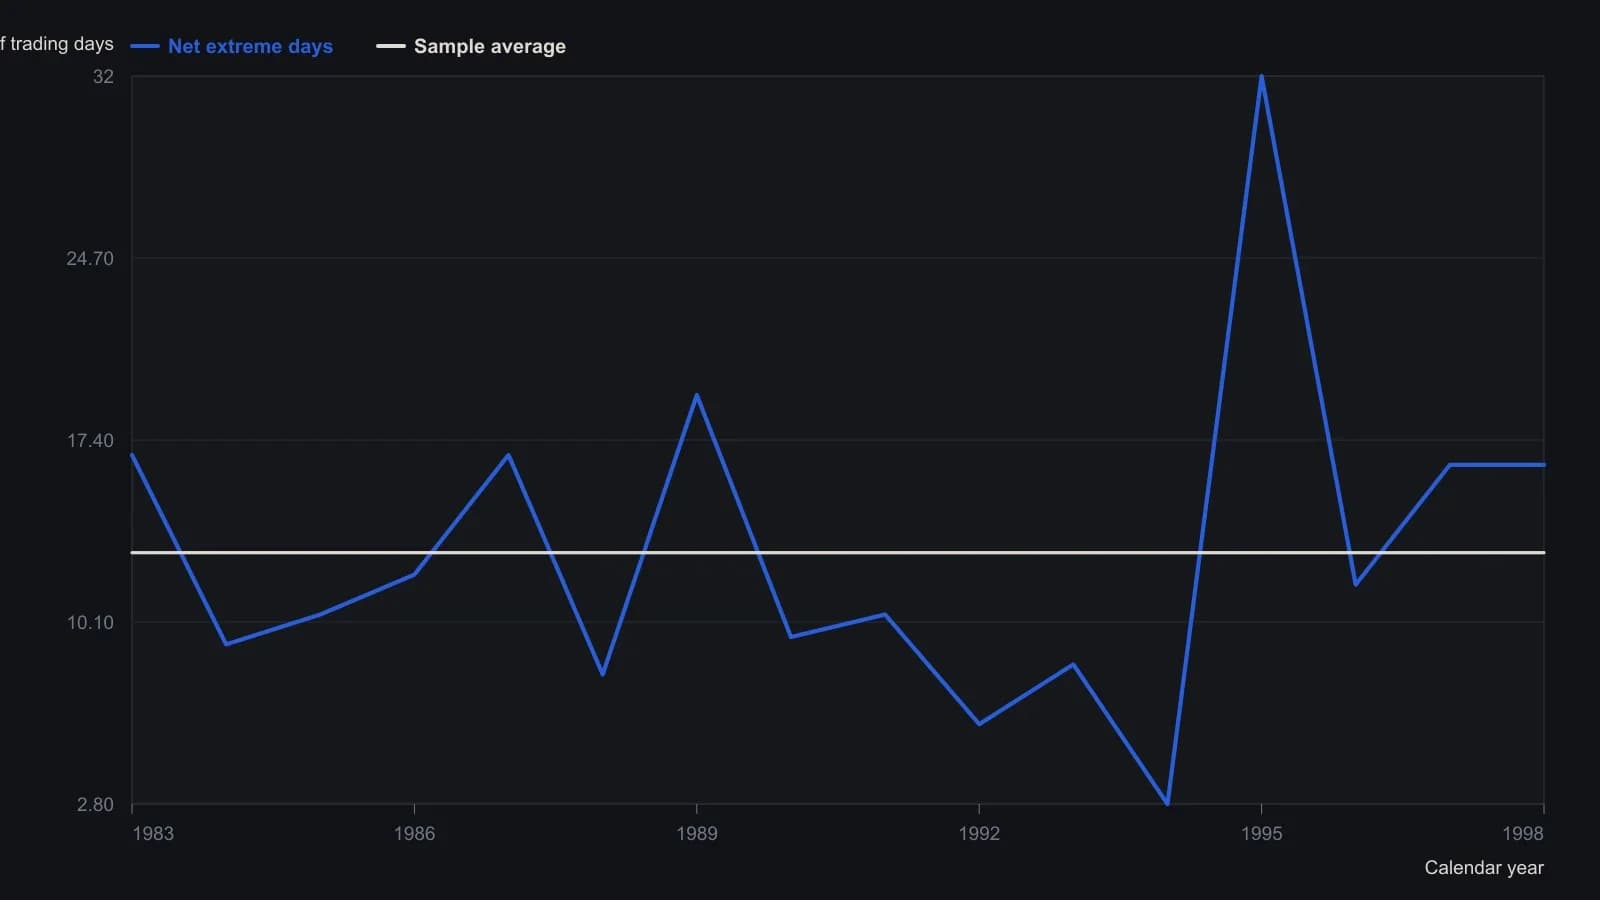
A year is up or down from the first close to the last. A net up day prints a high above the prior high of that calendar year; a net down day prints a low below the prior low. The percent uses about 250 sessions as the year.
One procedure rather than a daily-trend claim
Editorially, TradersWeek does not treat burst-concentration as proof that markets trend on most days. The same facts are used to test trend-following, moving-average direction, and volatility-stop size as one abstention-first procedure.
A trader who wanted every yearly vertical move would have to remain exposed through the long stretches that produce no new extremes. The practical question is when to stay out.
Direction, quiet ranges, and stop size
Direction is defined with a major-trend-average, a simple moving average of at least three to four months. Prices above it are treated as favoring larger up-bursts. Down-bursts against that average are described as usually smaller and shorter.
A quiet-range-filter compares last week's range with last month's range. A weekly range larger than the prior monthly range is presented as a simple check that volatility is already elevated and a reason for a small account to abstain.
Entering only in low-volatility periods is offered so a small account can use relatively small volatility stops. That is the small-stop-edge: the practice of placing relatively tight exits only after entering in a quiet period so a smaller account can keep loss size bounded.
When long-term following sat out a generation
The same text notes that long-term trend-following did not help equity holders from 1929 to 1955, when a new market high took 26 years. Editorially, that limit belongs inside the procedure: abstention and stop size are part of the test, not extras added after a direction rule is assumed to work.
All readings on this track · 12 readings
- 1989A close-only volatility reverse bound to average true range
- 1992Equity-curve average as a live-capital gate
- 1992Constructing volatility-adaptive trailing stops
- 1993Constructing skew-adjusted volatility stops and pyramid size
- 1999Evaluating a long-only breakout system with a volatility stop
- 1999When markets burst, not trend
- 2005Building entry rules with ratchet volatility stops
- 2005Pricing entries, stops and exits in range units
- 2013Constructing asymmetric volatility bands for reversal, trend, and stops
- 2015Mark the stop, the target, and the invalidation line before entry
- 2019Bounding capital risk with phase-aware stops
- 2019Measure the Bollinger Bands touch before adding engulfing and a volatility stop