1992issue C101-5
Equity-curve average as a live-capital gate
This archive workflow leaves a volatility stop always in the market and applies a drawdown limit to the account. A moving average of the equity curve withholds live capital until equity recrosses above that average, while hypothetical tracking keeps the same signals marked.
- Daily account equity is plotted as its own series so it can be judged as rising, falling, or flat, independent of the market-price chart.
- The volatility stop stays the always-in engine, and the drawdown limit withholds live capital when the equity curve sits below its moving average.
- Hypothetical tracking still marks the same signals while live capital is off, and the first recross trade is not taken with live funds.
- Cross-system allocation moves capital toward systems still above their equity averages and away from any system that has crossed below.
Equity as its own series
Daily account equity is plotted as its own series so it can be judged as rising, falling, or flat, independent of the market-price chart. That equity curve is the daily marked value of the trading account, treated as the series the risk filter reads.
The signal engine is an always-in stop-and-reverse volatility stop: an eight-day average true range times 20 percent is added to the close for a buy stop and subtracted from the close for a sell stop. The volatility stop stays the entry engine when live capital is withheld.
OEX volatility-system equity versus its 10-day average
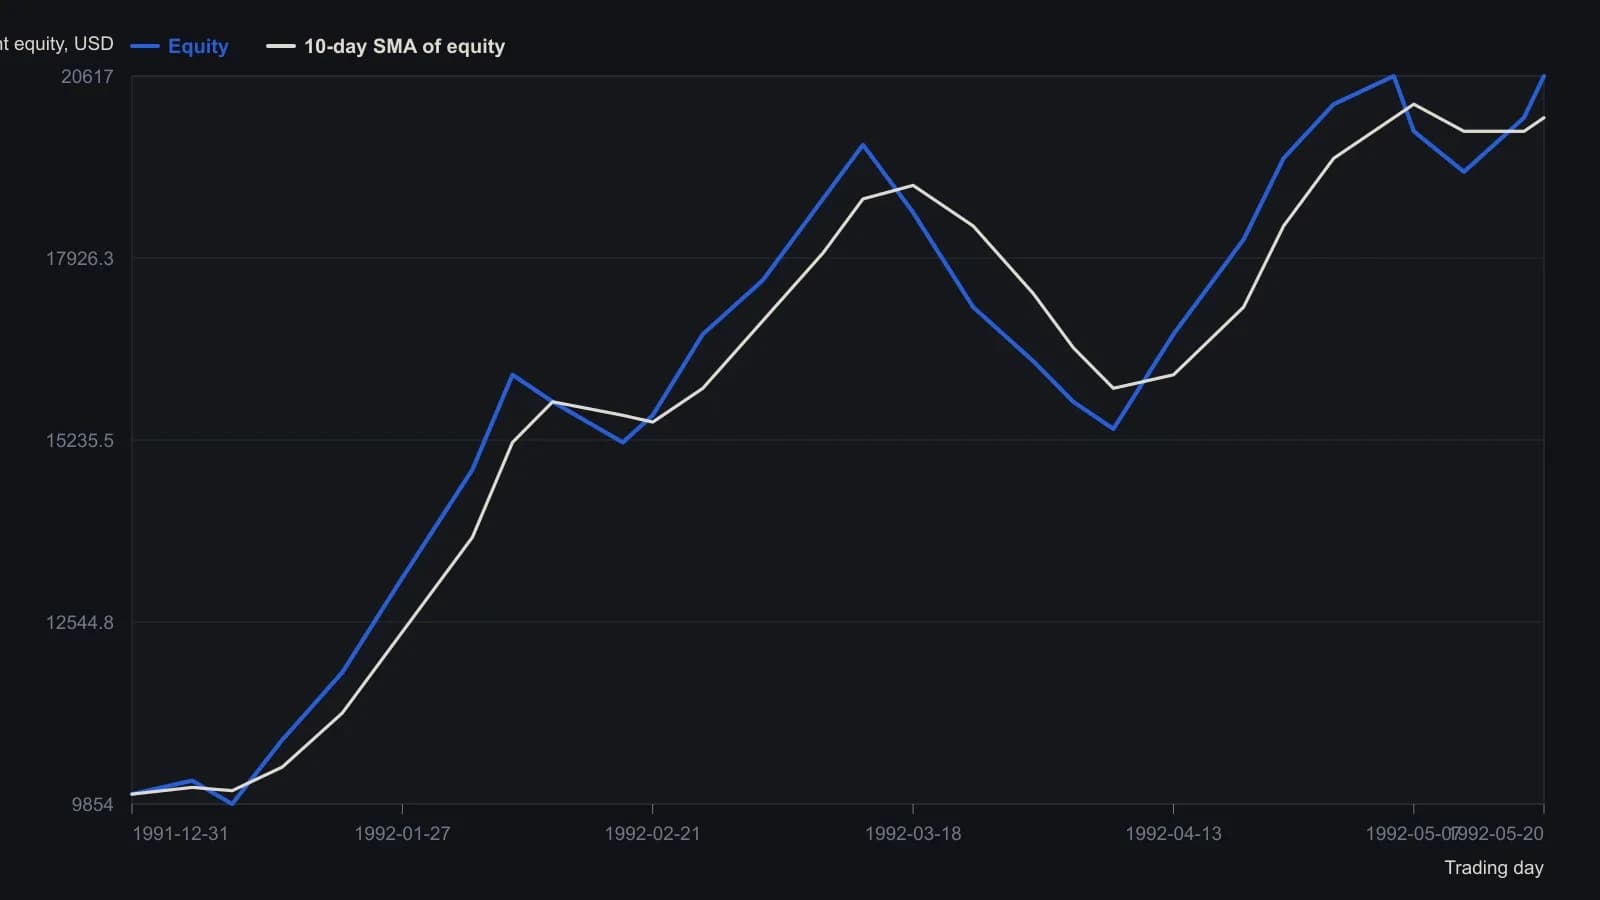
The magazine scan is a horizontal mirror of the printed figure, so the time axis was reversed before reading. Y values are approximate to a few hundred dollars; the raster cannot support finer precision. The 10-day average is the reference series.
The drawdown limit as a capital gate
Live capital is withheld whenever that equity series sits below a 10-day simple moving average of itself and is restored only after equity recrosses above the average. The moving average is the on-or-off threshold for live risk.
The first trade that lifts equity back through the average is not taken with live capital, because that recross is the event that turns live trading back on.
Hypothetical tracking
While live capital is withheld, the same signals are still marked hypothetically and the equity line is still updated so the recross can be dated. Hypothetical tracking is continued paper-marking of the same system, not a rewrite of the volatility stop.
A recorded demonstration window
In the 31 December 1991 to 20 May 1992 window, those withhold intervals were 11-21 February, 3 March through 7 April, and 7-18 May. The demonstration ran that always-in volatility stop on the Standard & Poor's 100 from a starting balance of 10000.
Cross-system allocation
A further construction keeps several systems funded at once and moves capital toward any system still above its equity average while cutting the system that has dropped below.
All readings on this track · 12 readings
- 1989A close-only volatility reverse bound to average true range
- 1992Equity-curve average as a live-capital gate
- 1992Constructing volatility-adaptive trailing stops
- 1993Constructing skew-adjusted volatility stops and pyramid size
- 1999Evaluating a long-only breakout system with a volatility stop
- 1999When markets burst, not trend
- 2005Building entry rules with ratchet volatility stops
- 2005Pricing entries, stops and exits in range units
- 2013Constructing asymmetric volatility bands for reversal, trend, and stops
- 2015Mark the stop, the target, and the invalidation line before entry
- 2019Bounding capital risk with phase-aware stops
- 2019Measure the Bollinger Bands touch before adding engulfing and a volatility stop