2019issue C1022-26
Measure the Bollinger Bands touch before adding engulfing and a volatility stop
A lower-band-touch entry with an upper-band exit is only a hypothesis until it is counted. This archive article follows a historical S&P 500 workflow that added a confirmed candlestick engulfing filter and a volatility stop before treating the envelope setup as a rule.
- A standard Bollinger Bands construction places an N-period simple moving average between upper and lower envelopes offset by M times the same-period standard deviation, with common defaults of N=20 and M=2.0.
- A lower-band-touch entry with an upper-band exit can generate tens of thousands of overlapping trades and a large peak-to-trough equity decline when run without a stop across a long S&P 500 sample.
- A confirmed bullish engulfing pattern whose range also touches the lower band reduced that sample to a few thousand trades and cut maximum drawdown from more than 30 percent to single digits in the same historical window.
- A volatility stop at the prior close minus a multiple of 14-day average true range, plus a screen that required more remaining room to the upper band than to the stop, converted the observation into a bounded entry rule.
Start with a standard envelope
A standard Bollinger Bands construction places an N-period simple moving average between upper and lower envelopes offset by M times the same-period standard deviation, with common defaults of N=20 and M=2.0. That frame measures price relative to a moving average and a same-period standard-deviation width. It is not yet an entry rule.
The first testable idea is simple: enter when price touches the lower band and exit when price reaches the upper band. Until that path is counted, the envelope is only a chart picture.
Count the unfiltered band-touch trades
A lower-band-touch entry with an upper-band exit can generate tens of thousands of overlapping trades when run without a stop across a long S&P 500 sample. The same unstopped run produced a large peak-to-trough equity decline.
Those historical counts show why the raw envelope idea has to be measured before it is treated as a standing rule. An unstopped band-to-band path is still only a hypothesis about mean reversion inside the envelopes.
Require a confirmed engulfing at the lower band
Requiring a confirmed bullish engulfing pattern whose range also touches the lower band reduced sample size from tens of thousands of trades to a few thousand. In the same historical window, that filter cut maximum drawdown from more than 30 percent to single digits.
The combined rule entered only after the most recent session closed above the prior day's high, with that two-bar engulfing structure already in place and at least one of those two lows touching the lower band. The candlestick engulfing condition was therefore not a loose visual overlay. It had to be complete, confirmed by a close above the prior day's high, and already in contact with the lower band.
Bound the entry with a volatility stop
A volatility stop set at the prior close minus a multiple of 14-day average true range, together with a reward-to-risk screen that required the remaining distance to the upper band to exceed the distance from the day's high to the stop, converted the observation into a bounded entry rule. The stop and the screen had to be in place before the setup was allowed to fire.
Among ATR multiples of 2, 3, and 4, the widest multiple was selected for later tests. Modest changes to the band-width coefficient around 2.0 did not overturn the directional character of the filtered results. Editorial: those checks belong to robustness of the historical workflow, not to a claim that the filtered rule is ready for live use.
Maximum drawdown as Bollinger-band filters are added
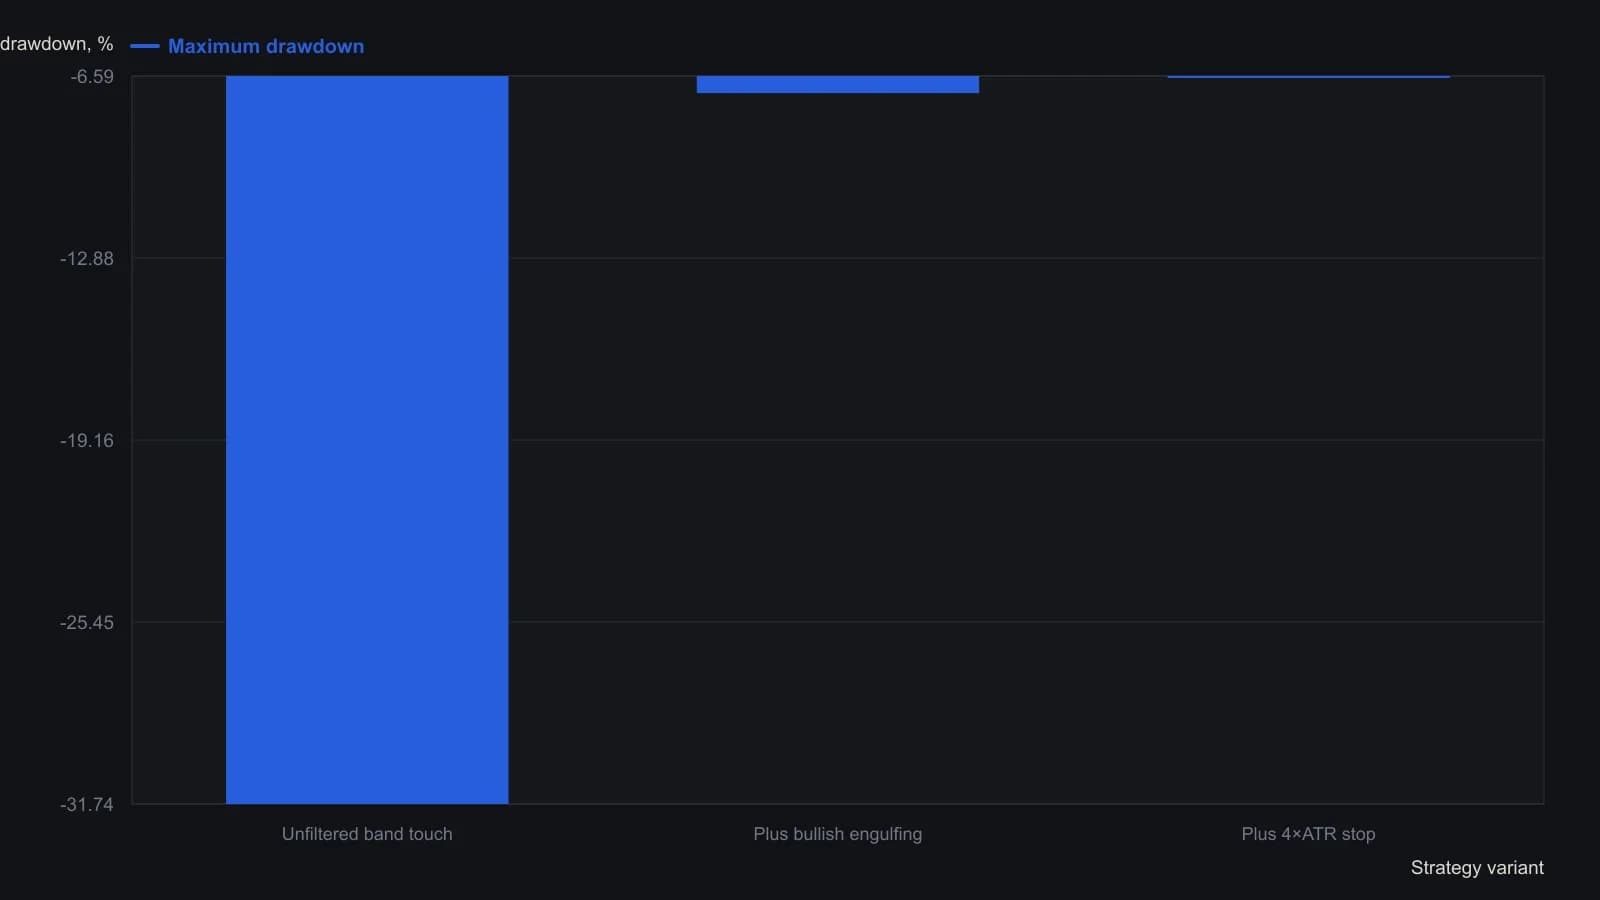
Universe is S&P 500 stocks priced between $5 and $500 with volume of at least 100,000 shares, traded only when SPY’s 100-day SMA was above its 400-day SMA. Each entry used $1,000 notional. Bands are the 20-day, 2-sigma envelope. The first two tests used no stop-loss; the third places the stop at yesterday’s close minus 4 times the 14-day ATR and requires reward/risk above 1.
All readings on this track · 12 readings
- 1989A close-only volatility reverse bound to average true range
- 1992Equity-curve average as a live-capital gate
- 1992Constructing volatility-adaptive trailing stops
- 1993Constructing skew-adjusted volatility stops and pyramid size
- 1999Evaluating a long-only breakout system with a volatility stop
- 1999When markets burst, not trend
- 2005Building entry rules with ratchet volatility stops
- 2005Pricing entries, stops and exits in range units
- 2013Constructing asymmetric volatility bands for reversal, trend, and stops
- 2015Mark the stop, the target, and the invalidation line before entry
- 2019Bounding capital risk with phase-aware stops
- 2019Measure the Bollinger Bands touch before adding engulfing and a volatility stop