2013issue C0824-29
Constructing asymmetric volatility bands for reversal, trend, and stops
This archive article treats band construction as one shared width. Typical price, a summing window, a deviation factor, and a lower-band adjustment have to be specified before the envelope can mark a reversal zone, act as a Trend filter around the median, or bound a Volatility stop.
- Typical price becomes a one-bar range, then a summed and scaled width, before any reversal, trend, or stop rule is applied.
- The envelope has four explicit inputs: a final averaging period, a volatility summing period, a deviation factor, and a separate low-band adjustment.
- The lower band is narrower than the upper band because the smoothed deviation is multiplied by the low-band factor.
- Editorial practice: change typical-price range, summing window, and the lower-band factor one at a time to see which later rule actually moved.
One width, three later jobs
The documented construction starts with a single envelope width. Editorial reading: that width has to be specified before later rules can use it to mark a reversal zone, to say which side of the median is the trend, or to bound an exit.
TradersWeek treats this as a construction lesson. Change the typical-price range, the summing window, and the lower-band factor one at a time so it is clear which later rule actually moved.
How the volatility input is built
Volatility input is built from typical price, defined as high plus low plus close divided by three. That series is then turned into a one-bar range versus the prior low when typical price is unchanged or higher, or versus the current low when typical price falls.
That range series is summed over a default 13-period window, divided by the same window, and scaled by a deviation factor to produce the raw envelope width.
Four inputs that define the envelope
The envelope is defined by four explicit inputs: a final averaging period, a volatility summing period, a deviation factor from the median price, and a separate low-band adjustment.
Documented defaults are an 8-period average, a 13-period sum, a 3.55 deviation factor, and a 0.9 low-band adjustment. Those inputs are described as usable across common bar types including range and Renko.
Why the lower band is narrower
The lower envelope is narrower than the upper one because the smoothed deviation is multiplied by the low-band factor. That construction matches the stated observation that price reaches the upper band more often than the lower band.
When the bands can be plotted
Bands are withheld until the bar count exceeds three averaging periods plus two summing periods. The plotted upper and lower lines then add and subtract the high and low deviations from an exponential average of the median series. The center line is a simple average of that series.
Reversal zone, Trend filter, and Volatility stop
In the swing-rule construction, an advance is expected to originate at the lower band or a later moving-average reference, and a decline at the upper band. Price is described as often remaining above the median line during an advance and below it during a decline.
A separate close-based trigger tightens the deviation factor to an example value of 1. A close through the upper band is the long-entry condition. A close through the lower band is the long exit and Volatility stop.
Editorial reading: once that width is set, the same envelope can serve as Bollinger Bands for a reversal zone, as a Trend filter on either side of the median, and as a Volatility stop on the exit.
STX daily close against the asymmetric volatility envelope
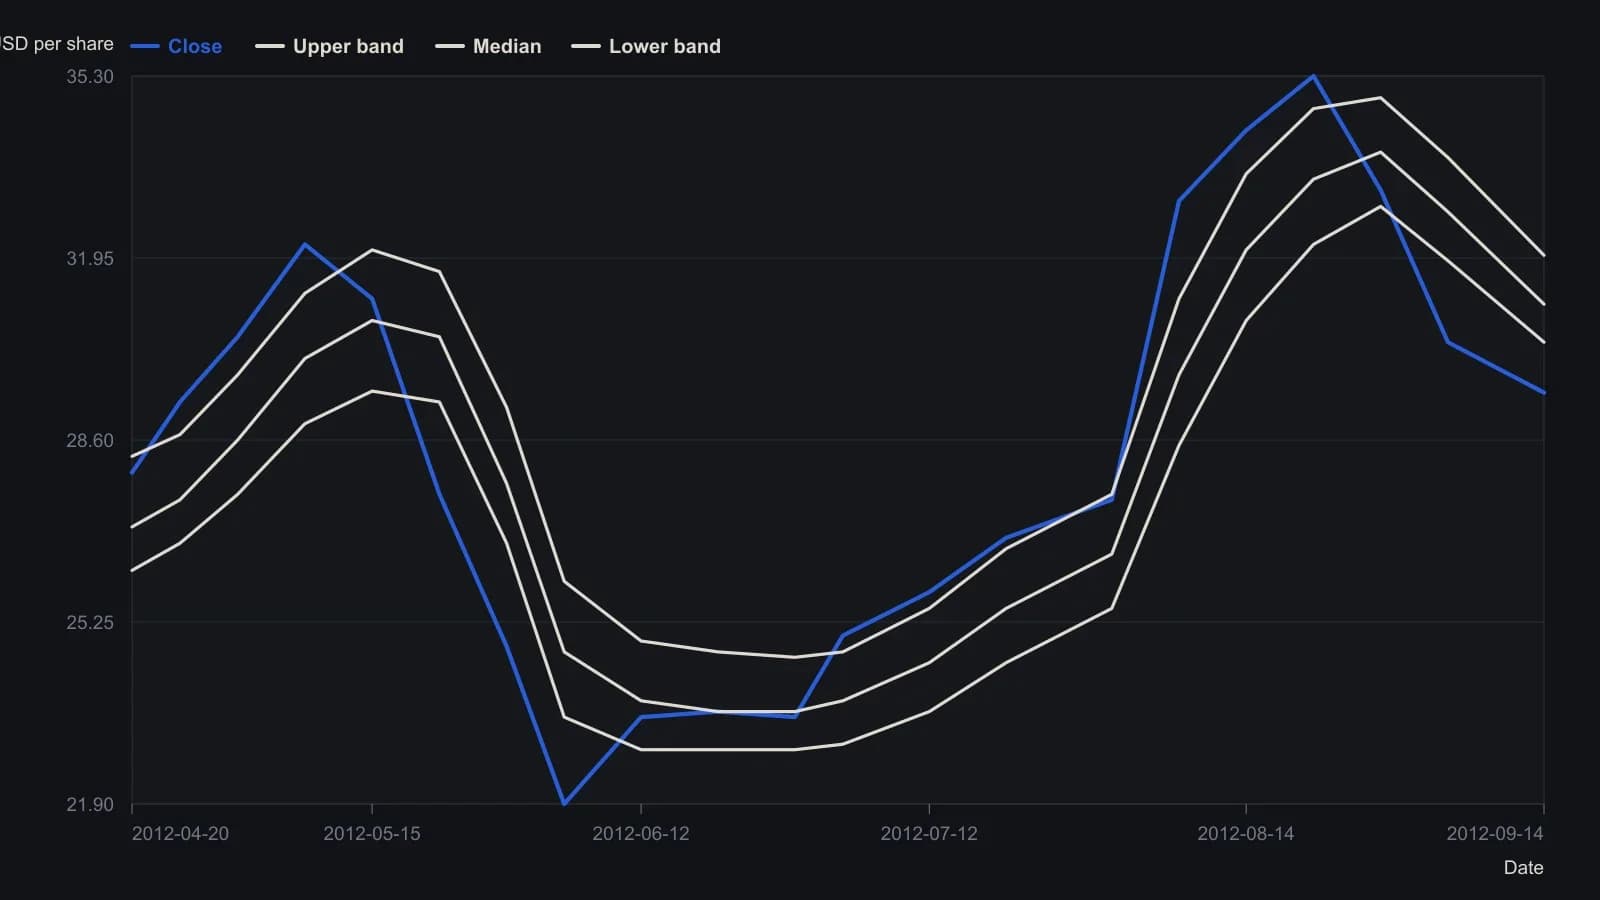
The overlay is SVEVolatilityBand(STX Daily, 8, 13, 1, 0.9). Deviation is set to 1 instead of the article default 3.55 so closes can tag the envelope; the lower band uses the 0.9 adjustment. Band and close vertices are digitized from the raster and are approximate except that labeled 29.47 close.
All readings on this track · 12 readings
- 1989A close-only volatility reverse bound to average true range
- 1992Equity-curve average as a live-capital gate
- 1992Constructing volatility-adaptive trailing stops
- 1993Constructing skew-adjusted volatility stops and pyramid size
- 1999Evaluating a long-only breakout system with a volatility stop
- 1999When markets burst, not trend
- 2005Building entry rules with ratchet volatility stops
- 2005Pricing entries, stops and exits in range units
- 2013Constructing asymmetric volatility bands for reversal, trend, and stops
- 2015Mark the stop, the target, and the invalidation line before entry
- 2019Bounding capital risk with phase-aware stops
- 2019Measure the Bollinger Bands touch before adding engulfing and a volatility stop