2015issue C0529-33
Mark the stop, the target, and the invalidation line before entry
This historical workflow treats construction as a pretrade task: the stop, the target, and the invalidation price are chosen before a position is opened. A volatility stop bounds the loss from recent high-low range, a measured-move target is projected from completed pattern height, and nearby support or resistance both hosts the planned sell price and can invalidate the setup if price holds through it.
- Construction in this workflow means choosing stop, target, and invalidation prices from volatility and chart structure before a position is opened.
- The volatility stop averages the daily high-low range over about 21 bars, multiplies that average by 2 or 1.5, subtracts the result from the current low, and trails upward as price rises.
- A measured-move target adds confirmed pattern height to the breakout-price, or half that height when a closer objective coincides with nearby overhead resistance.
- A first poke through a support floor is not an automatic sale. A later hold below that floor, followed by further downside, is the constructed exit.
Choose the exit prices first
Construction, in this historical workflow, means choosing stop, target, and invalidation prices from volatility and chart structure before a position is opened. Target and stop prices are chosen before entry. The target is placed just below overhead resistance, such as a prior peak, a valley, or a round number.
Build the volatility stop from recent range
A volatility stop is a trailing loss limit built from recent high-low range and subtracted from the current low. It is used to bound risk when no nearby chart stop exists. The historical construction averages the daily high-low range over about 21 bars, multiplies that average by 2, and subtracts the result from the current low. The same construction allows a multiplier of 2 or an alternative such as 1.5, and the stop trails upward as price rises.
A volatility stop is the fallback placement when no other nearby stop location is available. If the resulting stop is too far from current price in percentage terms, the rule is to skip the trade and look for a less volatile instrument. That gap is the stop-distance: the distance between current price and the planned stop, used as a filter that can reject a trade when the percentage risk is too large.
Project the measured-move target from pattern height
A measured-move target is built by adding a completed pattern or swing height to the breakout-price, with an optional half-height objective. The historical construction takes the height of a confirmed chart pattern and adds that height to the breakout-price. The same construction can use half the pattern height to set a closer objective, and that objective may coincide with nearby overhead resistance.
In a double-bottom example, pattern height is the distance from the lower trough to the intervening peak. That height is added to the close above the intervening peak to obtain the sell target. That close is the breakout-price: the confirmation level of the pattern from which the measured-move target is projected.
Use support and resistance as target and invalidation
Support-resistance covers prior peaks, valleys, congestion floors, and round numbers. Those levels are used as planned sell prices or as invalidation when price holds through them. The historical workflow places the target just below overhead resistance of that kind.
A first poke through a support floor is not treated as an automatic sale, because such probes can be false breaks that later recover. A later hold below the same support floor, followed by further downside, is treated as the constructed signal to exit.
ABAX double-bottom height projects a $27.33 sell target
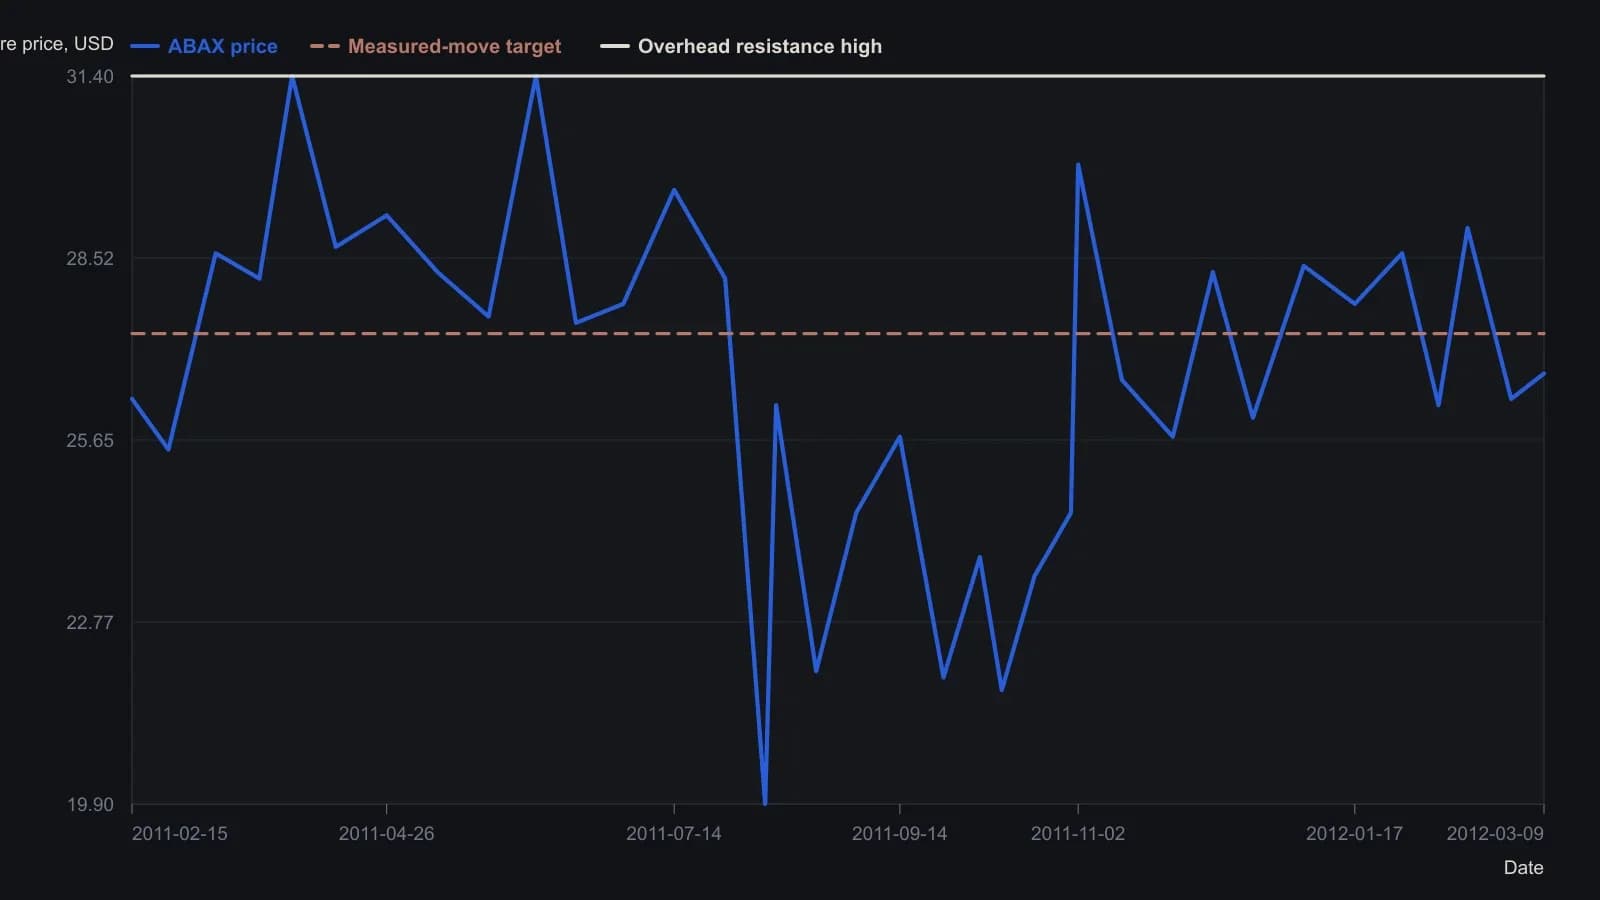
Full pattern height is the $24.50 confirmation peak minus the $21.67 lower trough. The author reports a 68% hit rate for double-bottom full-height targets, versus 86% when half the height is used.
All readings on this track · 12 readings
- 1989A close-only volatility reverse bound to average true range
- 1992Equity-curve average as a live-capital gate
- 1992Constructing volatility-adaptive trailing stops
- 1993Constructing skew-adjusted volatility stops and pyramid size
- 1999Evaluating a long-only breakout system with a volatility stop
- 1999When markets burst, not trend
- 2005Building entry rules with ratchet volatility stops
- 2005Pricing entries, stops and exits in range units
- 2013Constructing asymmetric volatility bands for reversal, trend, and stops
- 2015Mark the stop, the target, and the invalidation line before entry
- 2019Bounding capital risk with phase-aware stops
- 2019Measure the Bollinger Bands touch before adding engulfing and a volatility stop