2013issue C0734-38
When buy and hold needs a sell rule
A long-horizon holding can still be read as a charted trend that needs a falsifiable exit. A weekly support trendline, a trailing-exit from a peak, and a slow index moving-average overlay turn an open-ended hold into a testable sell procedure.
- A close beneath a weekly support trendline is a candidate trend-change signal, not an automatic sale.
- A trailing-exit treats a modest drop from a peak as a warning and a larger drop as a reason to reduce or close the position.
- In the historical sample, price dropped 10% or less from a peak in 75% of cases, which is why a drop beyond 10% was treated as a sell threshold.
- A 12-month simple moving average on a market index is a slow overlay for a candidate market-level exit, not a stock-specific sell.
The archive treats a long-horizon holding as something that can still be drawn on a chart. A trendline under weekly valleys, a trailing-exit from a peak, and a moving-average on a market index are the three sell checks used in the cases below.
TradersWeek editorial reading treats that mix as one procedure: an open-ended hold becomes a sell rule that later prices can mark true or false.
A weekly support line
A trendline, in the sense used here, is a line drawn under successive weekly valleys on a long-term price chart. A close beneath it is treated as a candidate trend-change signal, not an automatic sale.
On a weekly log-scale chart of Lamar Advertising, a support trendline touching valleys in late 2003 and 2005 first produced a close beneath the line in 2007. The archive presents that close as a trend-change clue rather than an automatic sale.
A trailing-exit from the peak
A trailing-exit is a peak-referenced sell procedure that treats a modest drop from a high as a warning and a larger drop as a reason to reduce or close the position.
In a 1,745-stock sample of issues priced over $3 from January 1990 through April 2012, the three most frequent peak retraces were 5%, 6%, and 7%, together about one-third of the observations. In that same sample, price dropped 10% or less from a peak in 75% of cases, which is why a drop beyond 10% was treated as a sell threshold.
Blue-chip holdings
A blue-chip, as used here, is a high-quality name with a history of rising earnings and dividends. It is the case where a peak-to-trough percentage drop is used as the first sell filter.
A money-manager sell protocol for blue-chip holdings treated a 5% drop from a peak as a warning that triggered fundamental review, and a 10% drop as a red-light event prompting sale of at least half the position.
Peaks that were not reclaimed
A price-mountain is a long-horizon chart profile in which a multi-year advance ends in a sharp peak and then fails to reclaim that peak for years.
A monthly linear chart of Intel showed a late-1990s advance that accelerated into a nearly $76 peak in late 2000 and then failed to reclaim that peak through the years shown into 2013.
A monthly linear chart of Anadigics showed a 1999-2000 spike that spent two months above $100, peaked at $112 in March 2000, and a year later printed a $10.50 low.
Intel monthly share price, 1995–2013
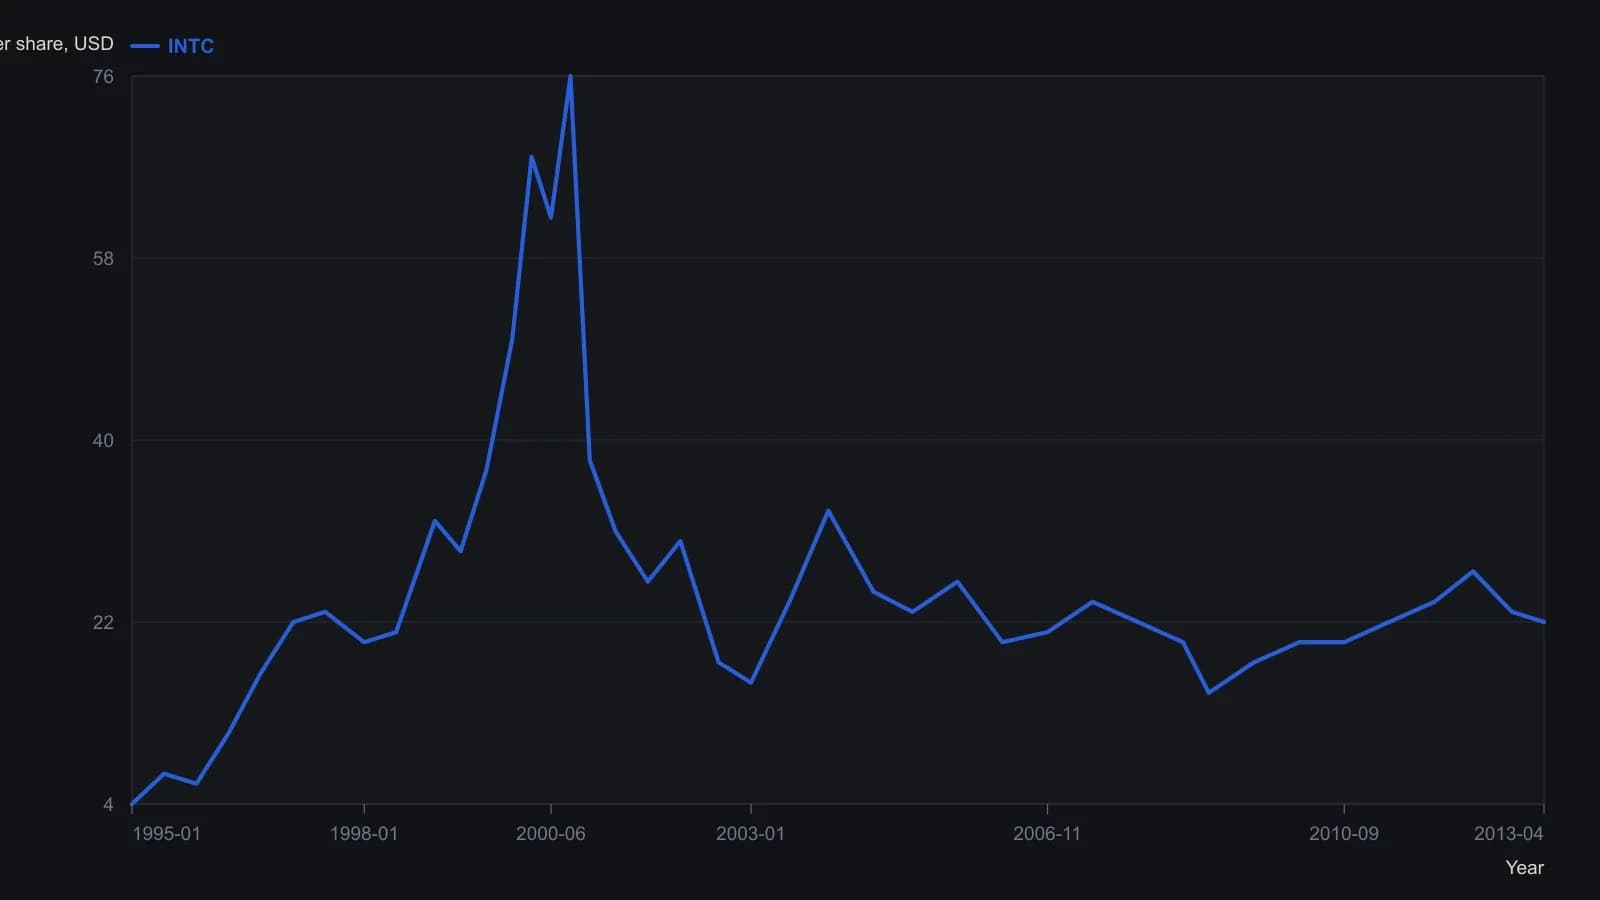
Linear monthly bars. The late-2000 peak of nearly 76 dollars is stated in the source; other points are approximate closes read from the raster and rounded to whole dollars.
Industry direction and market direction
An industry-and-market-trend is a visual count of whether most peers and the broader market are rising or falling over the life of the holding. It is used to confirm or veto a chart-based sell.
In a filtered set of actual long-only trades, holdings made while both the industry and the market rose averaged a 15% gain, and holdings made while both fell averaged a 10% loss. In that same trade set, an industry decline with a rising market averaged a 7% loss, while an industry advance with a falling market averaged a 7% gain, so industry direction outweighed market direction.
A slow index overlay
A moving-average, in this archive, is a 12-month simple average of an index used as a slow overlay. An index close beneath it is a candidate market-level exit rather than a stock-specific sell.
A 12-month simple moving average on a market index was used as a sell overlay when the index closed below the average. One historical application sold half a portfolio and then saw the market reverse higher.
TradersWeek editorial reading: that reversal keeps the overlay in its archive role. An index close beneath the average is a candidate market-level exit, not a completed forecast and not a stock-specific sell.
Three checks, one sell procedure
TradersWeek editorial reading: the three checks do not replace one another. The trendline marks a possible change in weekly structure, the trailing-exit sizes a drop from a peak, and the moving-average asks whether the market index has closed beneath a slow line.
Read that way, a buy-and-hold position is still a charted trend. It has a sell procedure that later prices can confirm or veto, including through an industry-and-market-trend count over the life of the holding.
All readings on this track · 18 readings
- 1988Constructing a mechanical trend system with independent trailing exits
- 1991Write a staged RSI exit book with trailing stops
- 1993Evaluating filter-trigger trailing exits after breakouts
- 1995Weekly-close breakout entry and trailing exit in Eurodollars
- 1996Evaluating moving-average turn entries and slope exits
- 1997Precommit an equity-risk cap and a profit-retracement exit
- 1998Exit stops before entries
- 1998Exit rules evaluated with a fixed random entry
- 2002Construct the stay-or-flatten decision before entry
- 2006Audit the stop, trail, and risk-reward stack as one procedure
- 2007Building a momentum system with relative strength and trailing exits
- 2013When buy and hold needs a sell rule
- 2013A mechanical trend toolkit that turns screens into one entry-exit procedure
- 2014Is a two-period relative strength index, a channel breakout, and a trailing exit one long-only procedure?
- 2016Trend-aligned option entries and trailing exits
- 2017Monthly three-black candles as a trailing exit
- 2018Evaluating profit-taking and reentry in trend following
- 2020Treat the zigzag threshold as a volatility-scaled construction variable