1996issue C061-10
Evaluating moving-average turn entries and slope exits
A single moving average is split into a rule-based entry on the average's own V-turn and a trailing exit that waits for the trend-speed index to collapse. Editorial reading: judge the pair by the failure each contract still cannot cover, not by one blended score.
- A single-average crossover can open and close repeatedly while price chops around the average, producing a clustered false entry of short losing trades.
- A dual-average cross can cut those clustered entries, but using the same dual cross as an exit creates lag giveback because price must travel farther before the close.
- The evaluated procedure assigns different logic to each side: a long only when the average's prior value is the lowest of the last four bars, and a trailing exit when the trend-speed index falls through 0.40.
- Two holes remain. A fast decline can delay the speed-threshold exit until near the low, and after that exit there is no re-entry path unless the entry average has also reversed.
One crossover, two jobs
A single-average crossover can open and close repeatedly while price chops around the average, producing a cluster of short losing trades. That pattern is a clustered false entry: repeated open-and-close signals while price oscillates around an average in a non-trending stretch.
Waiting for a faster average to cross a slower one can cut those clustered entries. Using the same dual cross as an exit requires price to travel even farther before the position is closed. The extra travel is lag giveback: open profit given back because an exit must wait until price, or a slower second average, travels far enough to confirm a reversal.
A turn entry and a speed exit
The evaluated procedure assigns different logic to entry and exit instead of reusing one crossover rule for both sides of the trade.
A moving average is a lookback average of ordered prices used as a baseline path whose level, turn, and recent range can be measured on a fixed sampling interval.
The rule-based entry opens a long only when the average's previous value is the lowest of the last four bars. The signal is a V-turn in the average rather than a price cross of the average.
The trailing exit stays open while a scaled recent range of the same average remains elevated. The exit measure, a trend-speed index, is the five-bar high-to-low range of a 28-bar average, divided by the close and multiplied by 100. The reading reflects how fast the average is traveling rather than which way price is pointed. The long is closed when that reading falls through 0.40 after having been at or above it.
The worked example is long-only on a daily equity-index series. It stands aside in cash when not long and is framed as a signal procedure without a separate risk-control overlay.
What the comparison recorded
Parameter tests varied average length and exit threshold against single-average and dual-average baselines. The records were win and loss counts, win share, average win-to-loss size, and capital efficiency.
Capital efficiency is the sum of winning-trade dollars divided by the sum of losing-trade dollars. A reading below 1.00 means the procedure returned more than it extracted on that sample.
The comparison table was presented as an optimized illustration of relative tendencies. Other samples would change the figures. The spread of outcomes was treated as more informative than any single best cell.
Failures the split still cannot cover
If price falls after entry, the speed-threshold exit may not fire until the decline itself slows. The close can arrive near the low rather than soon after the reversal.
After a speed-threshold exit, if the entry average has not also reversed, the procedure has no re-entry path. A later continuation can be missed.
Trend analysis index on a 28-bar S&P average
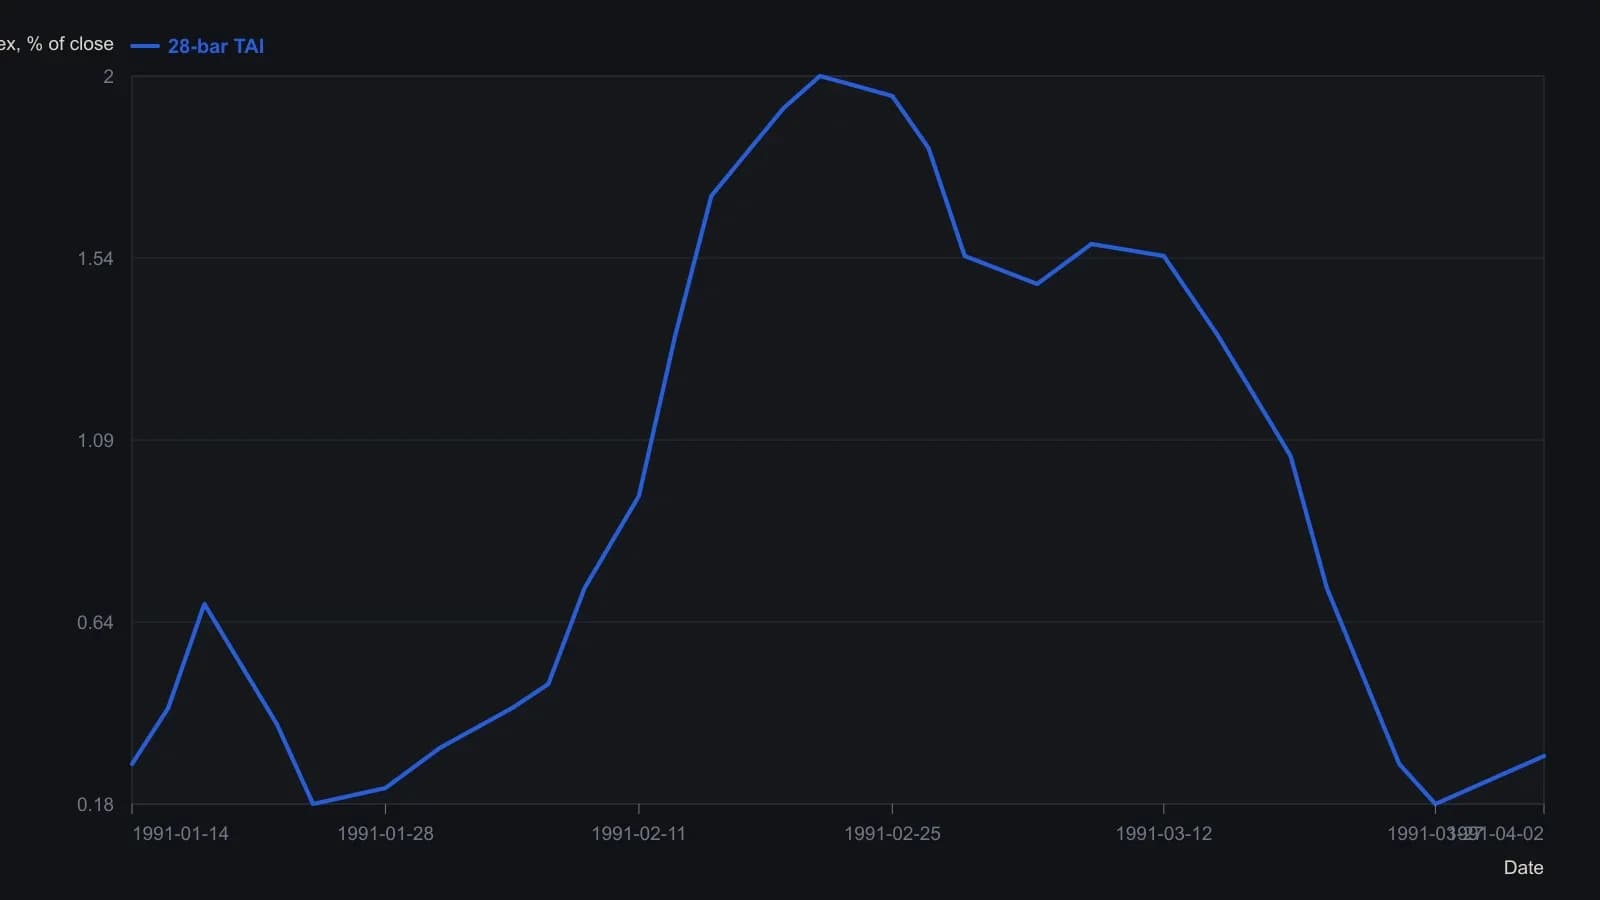
TAI is (highest minus lowest of the 28-bar simple average over the last five bars), divided by the close, times 100. The source states this particular window ran from a high of 2.0 to a low of 0.0. Daily closes on the lower pane are omitted because they sit on a different scale.
All readings on this track · 18 readings
- 1988Constructing a mechanical trend system with independent trailing exits
- 1991Write a staged RSI exit book with trailing stops
- 1993Evaluating filter-trigger trailing exits after breakouts
- 1995Weekly-close breakout entry and trailing exit in Eurodollars
- 1996Evaluating moving-average turn entries and slope exits
- 1997Precommit an equity-risk cap and a profit-retracement exit
- 1998Exit stops before entries
- 1998Exit rules evaluated with a fixed random entry
- 2002Construct the stay-or-flatten decision before entry
- 2006Audit the stop, trail, and risk-reward stack as one procedure
- 2007Building a momentum system with relative strength and trailing exits
- 2013When buy and hold needs a sell rule
- 2013A mechanical trend toolkit that turns screens into one entry-exit procedure
- 2014Is a two-period relative strength index, a channel breakout, and a trailing exit one long-only procedure?
- 2016Trend-aligned option entries and trailing exits
- 2017Monthly three-black candles as a trailing exit
- 2018Evaluating profit-taking and reentry in trend following
- 2020Treat the zigzag threshold as a volatility-scaled construction variable