2014issue C0555-56
Is a two-period relative strength index, a channel breakout, and a trailing exit one long-only procedure?
A 2014 implementation round-up presented a long-horizon equity procedure that first selected candidates and then applied explicit entry and exit rules. This archive article asks, as a TradersWeek editorial question, whether a two-period relative strength index, a channel breakout, and a trailing exit form one testable long-only procedure or three loosely stacked ideas.
- A 2014 implementation round-up presented a long-horizon equity procedure that first selected candidates and then applied an explicit set of entry and exit rules.
- A later reconstruction treated the method as a long-only system combining a relative strength index, channel breakouts, and moving averages, and reused one formula for screening, historical testing, and charting.
- That reconstruction waited for five technical, intermarket, and fundamental conditions, required a two-day relative strength index to leave oversold territory, and replaced the first exit with a trailing stop at the 20-day low.
- Editorial reading: the design task is to decide whether the oscillator, the channel location rule, and the trailing exit are one testable long-only procedure or three ideas stacked after the fact.
Candidates first, then entry and exit rules
A 2014 implementation round-up presented a long-horizon equity procedure that first selected candidates and then applied an explicit set of entry and exit rules.
One daily-chart example applied the procedure together with six-period and 200-period exponential moving averages and a two-period relative strength index.
Another daily-chart example marked an entry and an exit when relative strength index, average-volume, and beta conditions were jointly met.
One long-only reconstruction
A later reconstruction treated the method as a long-only system combining a relative strength index, channel breakouts, and moving averages, and reused one formula for screening, historical testing, and charting.
That reconstruction waited to enter until five technical, intermarket, and fundamental conditions were already in place and a two-day relative strength index then crossed above 5 from oversold.
The relative strength index here is a short-lookback oscillator of sequential prices. The two-period reading licenses entry only after it leaves oversold territory.
The breakout is a long-only location rule that treats a move through a defined price channel as the entry once screening conditions are already true.
Filters shown on the daily chart
The same reconstruction displayed a 200-day beta series, quarterly earnings dates, and volume against a 10-day average on the daily chart used to illustrate the rules.
A beta filter is an intermarket screen that compares a name with a broader market series over a long lookback such as 200 days. An earnings-surprise filter is a non-price screen that asks whether the latest quarterly report beat the standing estimate before a technical trigger is allowed. A volume average is a participation check that compares current volume with a short average such as 10 days.
One implementation dropped a multi-year record of positive earnings surprises as a required filter because that extra condition would have reduced the number of signals to a handful.
UGI daily price with two-period RSI and 200-period EMA
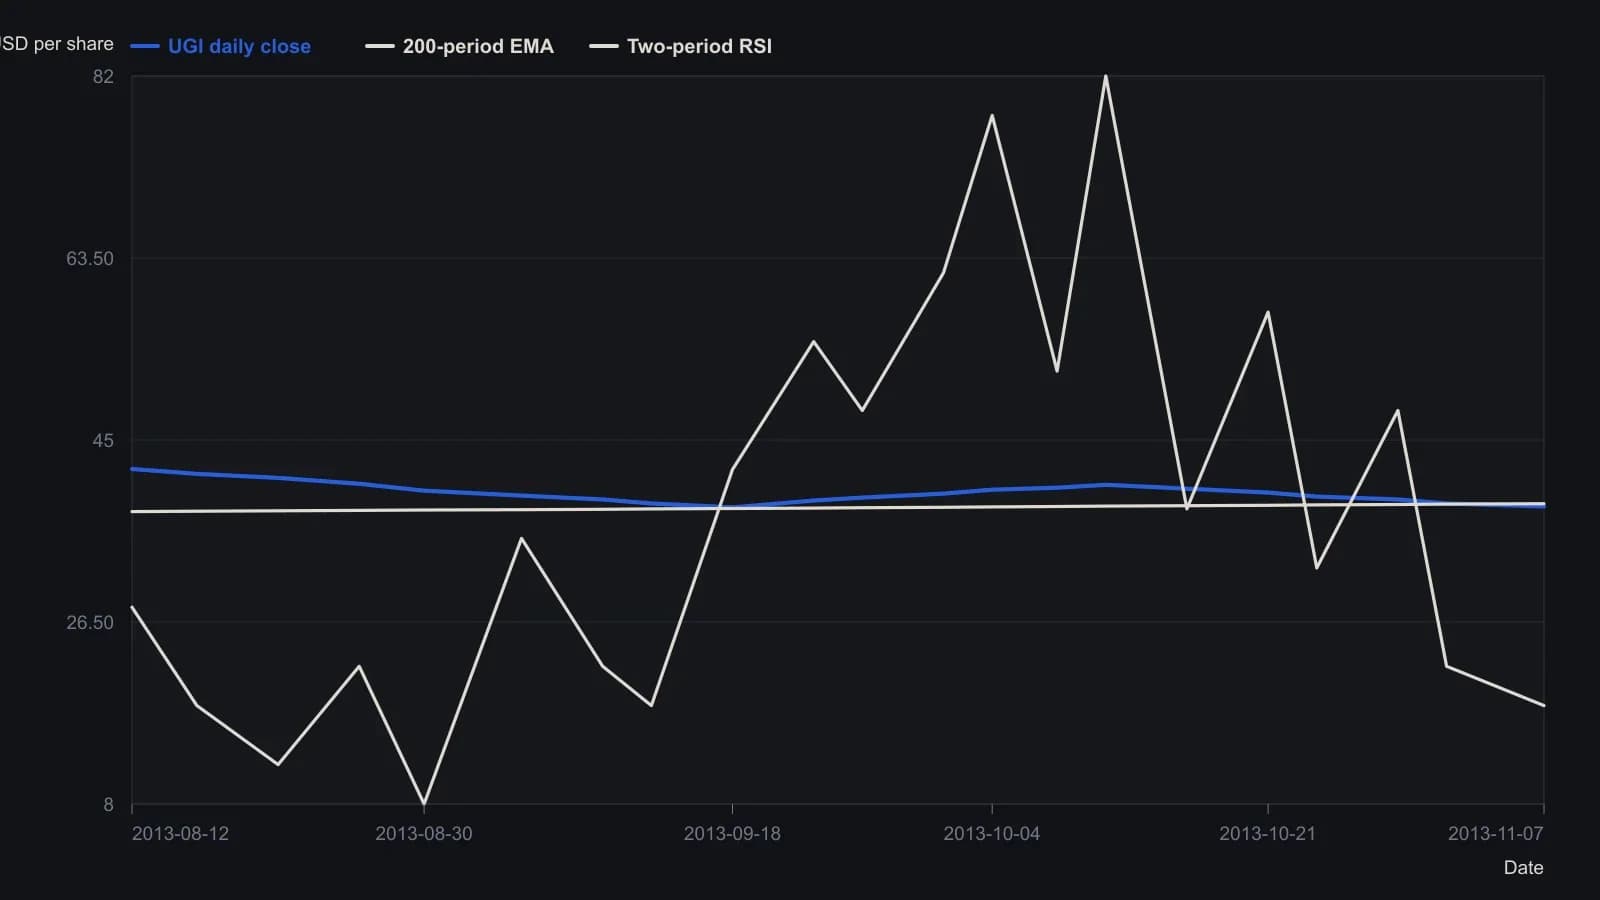
Values are approximate visual readings from the TradeStation daily UGI screenshot. Price is in dollars per share on a linear scale from about 37.50 to 42.50; RSI is 0–100. Calendar dates on the x-axis are mid-August through early November 2013, inferred from the month ticks. The six-period EMA overlay was not digitized as a separate series.
The exit that replaced the first rule
The same reconstruction replaced the originally proposed exit with a trailing stop at the 20-day low of daily prices after judging the first exit too prone to false signals.
A trailing exit is a holding-period rule that follows price by resting a stop at a recent low so the exit can be tested with the entry.
Editorial reading of the combination
Editorial reading: if the pre-entry screens, the two-period oscillator, the channel location rule, and the stop at a recent low are stated in one order and reused in one formula, they can be examined as a single long-only procedure. If any piece can be swapped without restating the others, they remain loosely stacked ideas.
Editorial reading: the later choice to replace the first exit, and another implementation's choice to drop the multi-year earnings-surprise record, show which conditions those later writers treated as optional and which they kept in the entry-to-exit sequence.
All readings on this track · 18 readings
- 1988Constructing a mechanical trend system with independent trailing exits
- 1991Write a staged RSI exit book with trailing stops
- 1993Evaluating filter-trigger trailing exits after breakouts
- 1995Weekly-close breakout entry and trailing exit in Eurodollars
- 1996Evaluating moving-average turn entries and slope exits
- 1997Precommit an equity-risk cap and a profit-retracement exit
- 1998Exit stops before entries
- 1998Exit rules evaluated with a fixed random entry
- 2002Construct the stay-or-flatten decision before entry
- 2006Audit the stop, trail, and risk-reward stack as one procedure
- 2007Building a momentum system with relative strength and trailing exits
- 2013When buy and hold needs a sell rule
- 2013A mechanical trend toolkit that turns screens into one entry-exit procedure
- 2014Is a two-period relative strength index, a channel breakout, and a trailing exit one long-only procedure?
- 2016Trend-aligned option entries and trailing exits
- 2017Monthly three-black candles as a trailing exit
- 2018Evaluating profit-taking and reentry in trend following
- 2020Treat the zigzag threshold as a volatility-scaled construction variable