2006issue C101-7
Lagged commercial nets and a weekly accumulation trigger
Weekly Commitment of Traders figures arrive about a week after the Tuesday snapshot they describe. In the archive workflow, commercial net positioning is the slow regime map, and a long-side hypothesis waits until a weekly accumulation-distribution line is also above its 28-period average.
- Weekly Commitment of Traders figures break down Tuesday open interest and are issued Friday at 15:30 Eastern, so the matching chart horizon is weekly rather than daily or monthly.
- Small-trader and large-noncommercial extremes are set aside. Commercial hedgers that often lean opposite price because they hedge owned inventory supply the regime map.
- A long-side hypothesis is considered only when commercials are net long and the weekly accumulation-distribution line is above its 28-period moving average.
- The combined overlay is an intermediate- to long-term bullish-context tool, not a complete market indicator.
A Friday release of Tuesday open interest
Weekly Commitment of Traders figures break down Tuesday open interest for markets in which at least 20 traders hold reportable positions. The release is issued Friday at 15:30 Eastern. The three reported groups are cash-market commercial hedgers without position limits, large noncommercials that typically follow trends, and small traders below reporting thresholds.
Because the snapshot is about a week old on arrival, the matching chart horizon is weekly rather than daily. Monthly charts are too slow to mark when commercials become heavily net long or short. The weekly open-interest breakdown is used as a lagged intermediate-horizon regime map rather than an entry clock.
Why commercial nets set the regime
On the live-cattle December 2006 and lean-hog October 2006 weekly examples, small-speculator net positions sat net short at critical turning points. That is why the small-trader category is discarded as a regime filter.
On the gold October 2006 weekly chart, large-speculator net-long extremes coincided with later price declines, including a May 19, 2006 peak after those accounts reduced net longs. An accumulation-distribution line tracked price more closely than that positioning series. On the September 2006 10-year note weekly chart, extreme large-speculator net shorts preceded price rises and extreme net longs preceded declines.
In the 2003 to 2006 weekly coffee, platinum, sugar, natural-gas, and crude examples, commercials were net long before major advances. They often leaned opposite price because they hedge owned inventory rather than speculate.
When the weekly accumulation pair may fire
The accumulation-distribution line is a weekly price-and-volume accumulation series used as a chart-scale timing trigger once the commercial regime is already net long. The moving average applied to it is a 28-period average of that accumulation series that confirms or withholds the timing trigger against an explicit lookback baseline.
A long-side hypothesis is considered only when commercials are net long and the accumulation-distribution line is above its 28-period moving average. If commercials are net long but that pair is not, the trigger waits. If commercials flip negative, the pair cannot fire until commercials are net long again.
Weekly futures price during the commercials-and-AD bull regime
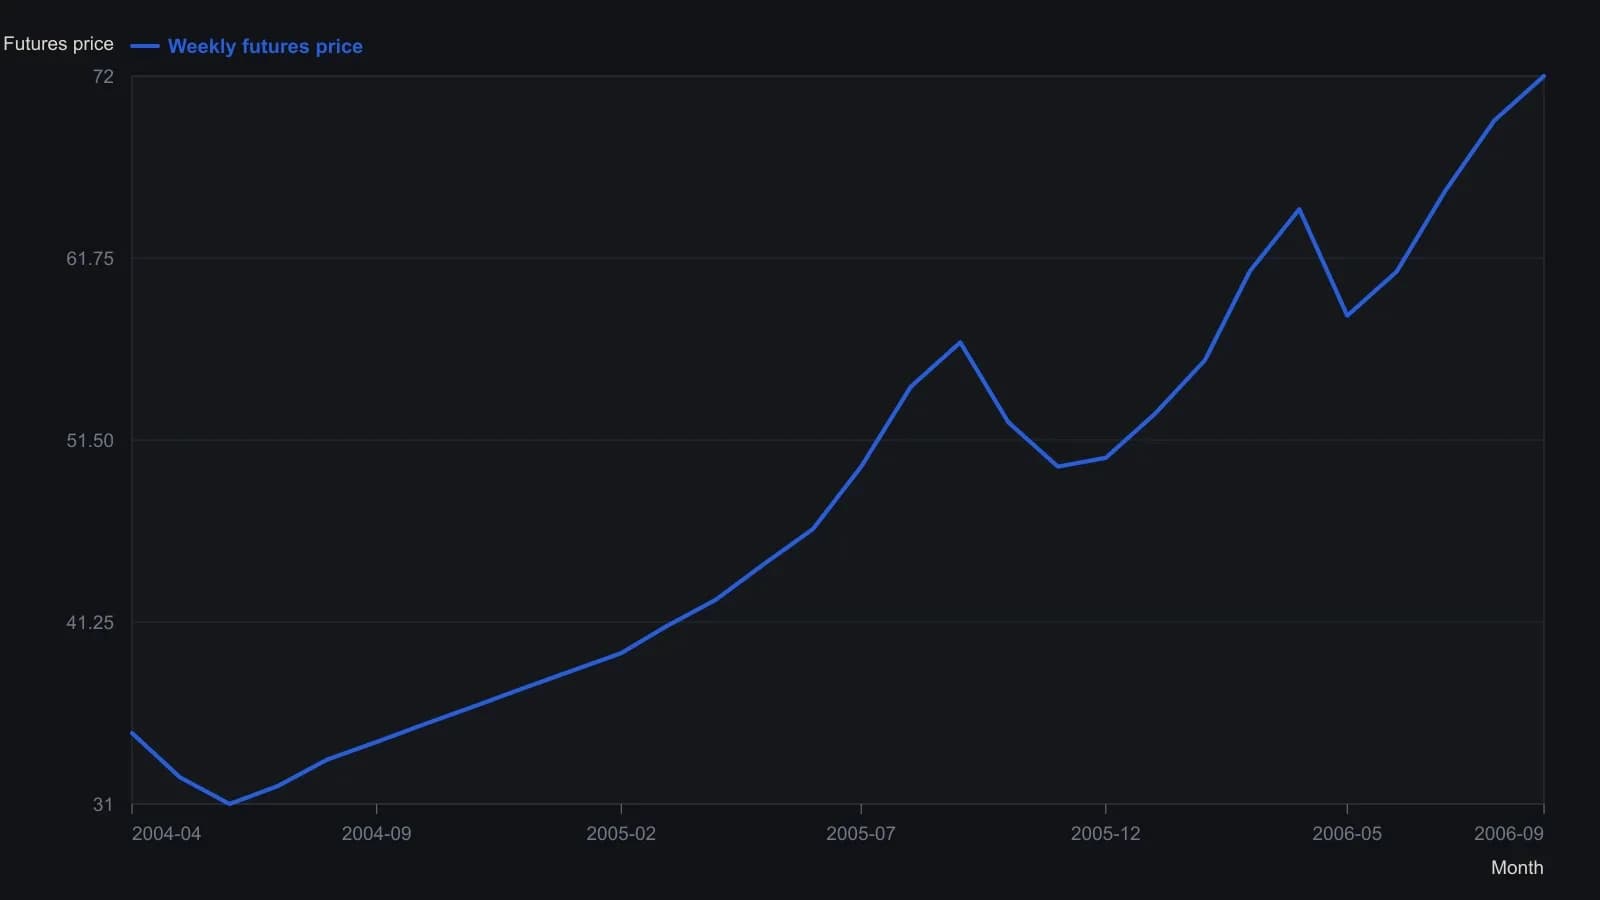
Digitized from the weekly candlestick pane. Printed y-labels run 28.79 to 73.26; values are rounded to the nearest half point because the raster cannot support the printed hundredths. The Williams AD and 28-period average in the lower pane are visible but that pane only prints 0 and −67.86%, so those series are not plotted.
When one overlay turns negative
If commercials stay net long and the accumulation-distribution pair is already constructive, either overlay later turning negative does not by itself cancel an existing-uptrend assumption. Only both turning negative raises the chance the advance will not persist. A commercial flip to net short after a rally starts is often read as hedge scaling rather than a top.
A bullish context tool
The combined overlay is framed as an intermediate- to long-term context tool. It is illustrated on crude weekly points where commercials were repeatedly net long before advances. It is described as more useful for bullish than bearish regime detection rather than as a complete market indicator.
All readings on this track · 8 readings
- 1995Constructing an accumulative swing index from open-high-low-close comparisons
- 2001Confirming a price-box break with on-balance volume and the accumulation-distribution line
- 2004Why on-balance volume and the accumulation-distribution line disagree
- 2006Lagged commercial nets and a weekly accumulation trigger
- 2007Constructing dominant cycles from participant accumulation
- 2011Linear regression overlays on volume-flow primaries
- 2014Lookalike money flow is not on-balance volume
- 2015Volume-free accumulation and a next-session bias overlay