2000issue C081-4
Constructing a Chaikin oscillator from the accumulation-distribution line
A Chaikin oscillator is a signed, volume-normalized reading built from an accumulation-distribution line rather than from price-only momentum. Each session is tagged by the close versus the high-low midpoint, those values are summed and divided by the same-period volume sum, and magnitude plus time spent above or below zero then grade the result.
- The oscillator is constructed from an accumulation-distribution line that combines close location with volume, rather than from price-only momentum.
- A session is counted as accumulation when the close is above the session midpoint and as distribution when it is below. The oscillator is the lookback sum of those values divided by the same-period volume sum.
- Fixed magnitude bands, time spent above or below zero, and persistency of money flow grade the reading as weak, bullish, bearish, or sustained.
- The sign and persistence of the oscillator are used to judge whether a chart-pattern breakout is occurring under accumulation or distribution. Spike extremes and large gaps are construction limits.
Start from the accumulation-distribution line
The oscillator is constructed from an accumulation-distribution line that combines close location with volume, rather than from price-only momentum. That line is a session series: a close above the high-low midpoint is treated as accumulation, and a close below that midpoint is treated as distribution.
The session midpoint is the average of the session high and low. It is the rule used to assign that session’s accumulation or distribution.
Normalize the lookback with volume
The Chaikin oscillator is a signed volume-normalized reading. It is formed by summing accumulation-distribution values over a chosen lookback and dividing by the same-period volume sum.
The oscillator equals the 21-period sum of accumulation-distribution values divided by the 21-period sum of volume. A 21-day window is treated as about one month, and other windows are allowed.
Grade magnitude
Readings from 0 to 0.10 are labeled weak buying, and readings above 0.10 are labeled bullish. Readings from 0 to -0.10 are labeled weak selling, and readings below -0.10 are labeled bearish.
Readings above 0.25 are labeled very bullish, and readings below -0.25 are labeled very bearish. Remaining above 0.20 for three months is treated as sustained heavy buying.
Grade duration and persistency
How long the oscillator stays above or below zero is used as evidence of sustained buying or sustained selling. Persistency of money flow is the share of a chosen lookback in which the oscillator remains above zero. One stated preference is more than 90% of readings positive over six months.
A lower oscillator peak is read as fading buying pressure. A higher oscillator low is read as fading selling pressure.
Read a breakout with volume-price analysis
Volume-price analysis is the joint reading of price structure with the oscillator’s sign, size, and time spent above or below zero. A 10% to 15% price pullback that keeps the oscillator positive is treated as a constructive volume-price setup.
The sign and persistence of the oscillator are used to judge whether a chart-pattern breakout is occurring under accumulation or distribution.
Alcoa Chaikin money flow around the December breakout
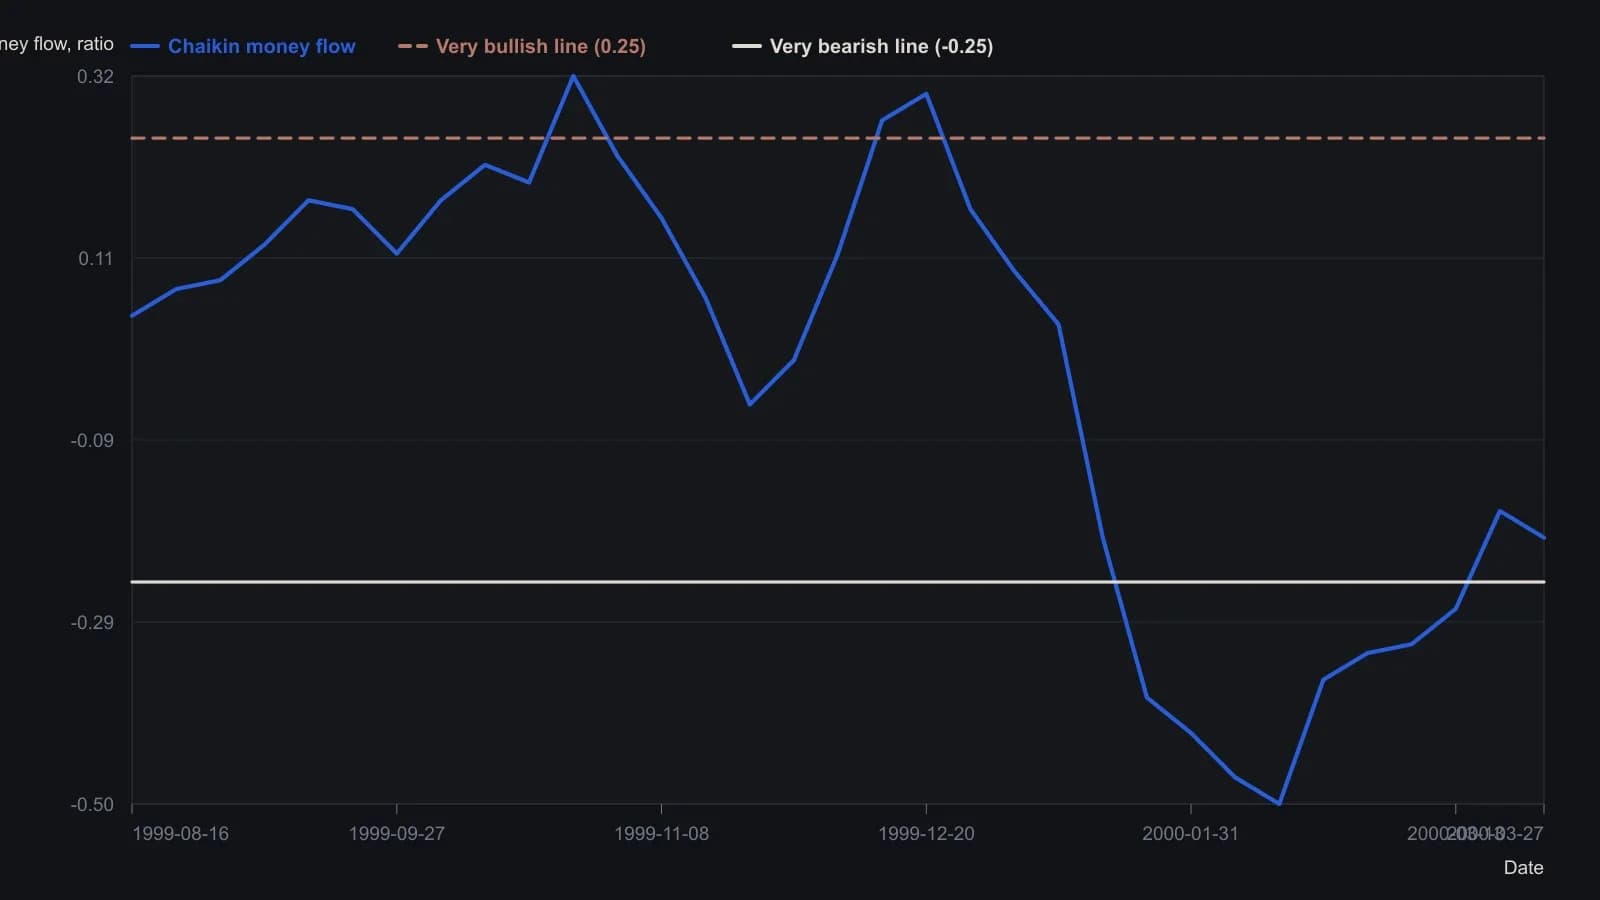
The source computes Chaikin money flow as the 21-session sum of accumulation-distribution divided by the 21-session sum of volume. Samples are weekly because the daily histogram is denser than the raster can support.
Construction limits
Spike extremes and large gaps are construction limits. The oscillator can sit at a peak into a spike top. A gap may not appear in the high-low midpoint, so the oscillator can move opposite the gap.
All readings on this track · 9 readings
- 1992Fitting oscillator parameters to stock personality
- 1994Constructing the Chaikin oscillator from close-in-range volume
- 1994Constructing Chaikin money flow and a double-exponential smoother
- 1994A three-lock reversal drill: line, oscillator, and volume
- 2000Constructing a Chaikin oscillator from the accumulation-distribution line
- 2005Volume-spike alerts versus direction from follow-through
- 2014A 2014 research stack as a classroom for volume-flow hypotheses
- 2015Money flow oscillator construction from volume pressure
- 2017Small-cap swing entries that wait for accumulation and Chaikin to clear