2015issue C128-11
Volume-free accumulation and a next-session bias overlay
Each session is coded as a volume-free accumulation and distribution sign and a close-to-close sign. Those signs are accumulated, the next session is placed in at most four historically counted buckets, and the two most frequent buckets become a short-horizon bias overlay rather than a standalone forecast.
- The accumulation and distribution input here is the close's location in the session high-low range, with the usual volume multiplier omitted.
- Each session is labelled with two plus-one or minus-one signs: whether that reading rose or fell, and whether the close rose or fell versus the prior close.
- Those signs are accumulated into a running pair so the next session can occupy at most four historically counted quadrants.
- After the quadrants are ranked by historical frequency, the two most common states are a confirmation-layer bias; tied or empty precedents produce no bias.
A countable short-horizon state
The editorial aim of this note is to teach a short-horizon bias as a countable classification problem. The archive workflow encodes each session, accumulates two binary signs, and ranks the next-session buckets by historical frequency.
The two most frequent states are then used as a directional hypothesis. In the archive construction that use is a bias overlay meant to sit beside other short-horizon readings.
Close location without a volume term
The accumulation and distribution line, in this construction, scores how near the close sits to the high versus the low. The usual volume multiplier is omitted, so the line is a pure OHLC-structure input.
The session reading is defined from the high, low, and close as ((close minus low) minus (high minus close)) divided by (high minus low).
Volume-price analysis ordinarily reads directional pressure from how price location and participation interact. Here the participation term is withheld so the remaining close-in-range component can be isolated against a close-to-close sign.
Two signs and a running pair
Each session receives a first sign of plus one or minus one according to whether that accumulation and distribution value rose or fell versus the prior session. It receives a second sign of plus one or minus one according to whether the close rose or fell versus the prior close. The second label is the close-to-close sign.
Those session signs are accumulated into a running pair. A change in either running total marks a change in short-horizon direction for that component. The pair of running totals is the cumulative binary pair, a compact code for each session's short-horizon state.
Four next-session quadrants
Because the two components each have only an up or down state, the next session can fall into at most four historically counted outcome buckets. Each bucket is a next-session quadrant formed by combining the two binary states.
After those buckets are ranked by historical frequency, the two most frequent buckets are treated as the next-session directional bias. Sessions with tied frequencies or no historical precedent receive no bias from this construction.
What the later pairing changed
An earlier pairing used the same close-to-close sign with the high-low range instead of the volume-free accumulation and distribution reading. The later construction substitutes that range term and applies the count to the S&P 500 cash index.
How the historical count was assembled
A comparative count of which next-day buckets occurred was assembled on S&P 500 end-of-day bars for a roughly one-year window ending 29 May 2015. Historical frequencies were drawn from data beginning 3 January 2000. Equal-probability and empty-precedent days were excluded from the hit count.
Those steps describe the historical workflow only.
ADCC versus CCHL next-session quadrant shares on the S&P 500
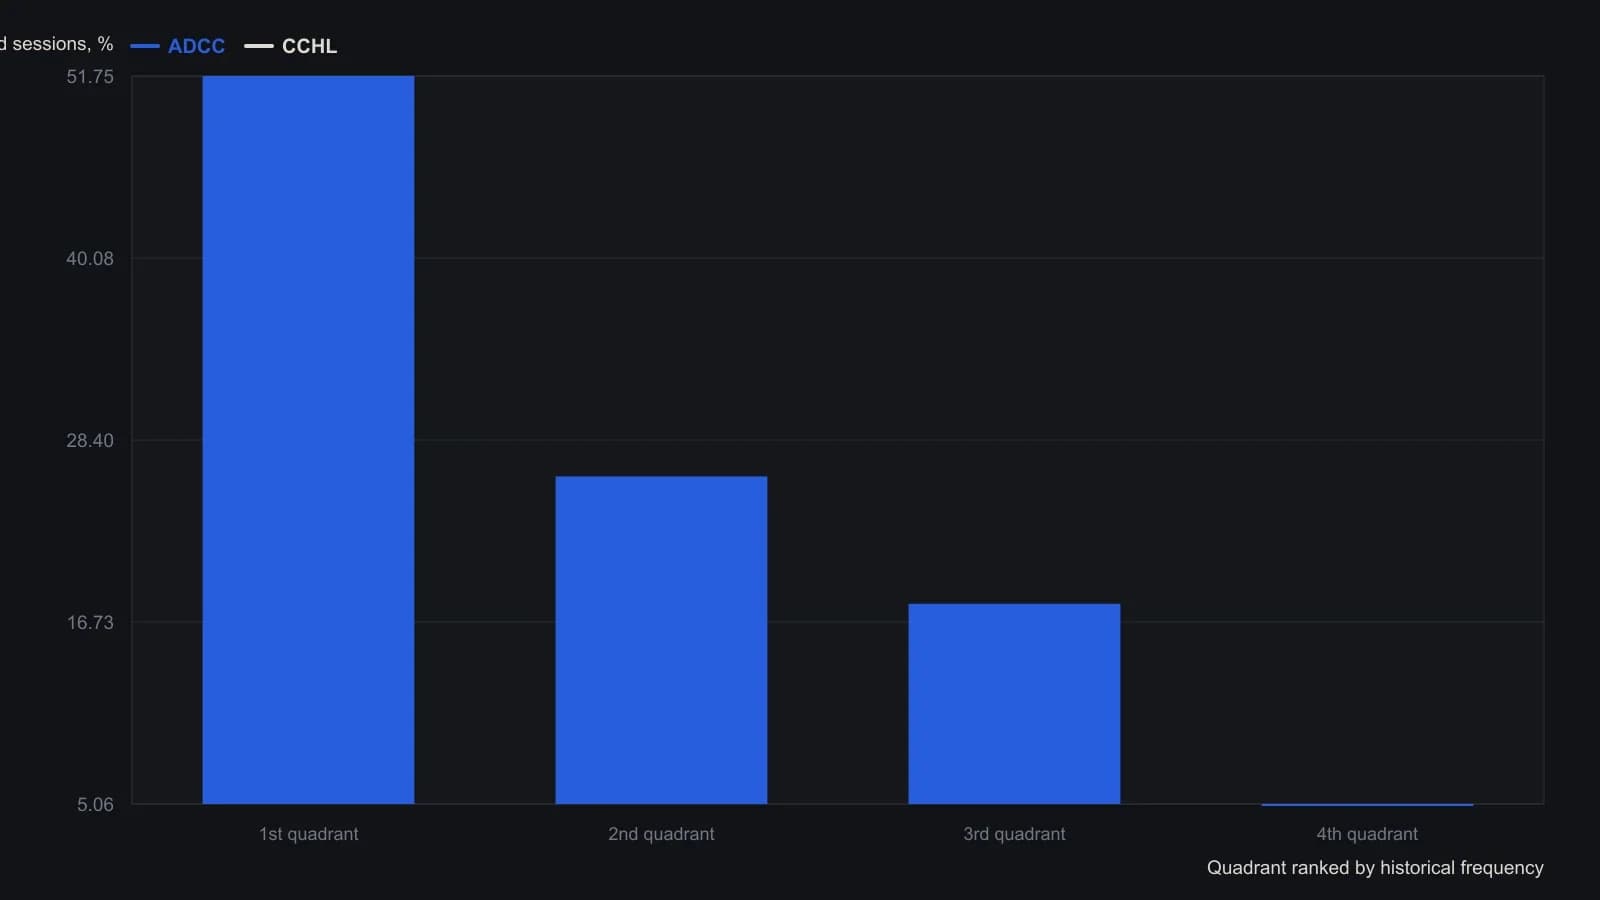
Equal-probability days and sessions with no historical precedent were omitted, leaving 257 ADCC days and 250 CCHL days. Historical lookups use S&P 500 data from 3 January 2000. The table dates the sample 6 May 2014–29 May 2015; the article body also cites 16 May 2014 as the start.
Editorial reading
The TradersWeek editorial reading is that the value of the construction is the classification step. Pairing a volume-free accumulation and distribution sign with the close-to-close sign, accumulating both, and ranking the four next-session quadrants turns a repeatable chart condition into a falsifiable hypothesis. The two most common historical states are that hypothesis. They do not replace other short-horizon tools.
All readings on this track · 8 readings
- 1995Constructing an accumulative swing index from open-high-low-close comparisons
- 2001Confirming a price-box break with on-balance volume and the accumulation-distribution line
- 2004Why on-balance volume and the accumulation-distribution line disagree
- 2006Lagged commercial nets and a weekly accumulation trigger
- 2007Constructing dominant cycles from participant accumulation
- 2011Linear regression overlays on volume-flow primaries
- 2014Lookalike money flow is not on-balance volume
- 2015Volume-free accumulation and a next-session bias overlay