2001issue C111-3
Confirming a price-box break with on-balance volume and the accumulation-distribution line
First draw the walls of a crowded price box from repeated failed tests. Treat the next break as a directional call only when the accumulation-distribution line and on-balance volume agree that the box is being quietly filled or quietly emptied.
- Map resistance and support from repeated failed tests, then treat the band between those walls as a resistance-support area.
- A rising test count is not a reliable standalone rule for when price will finally leave the box.
- Read the accumulation-distribution line and on-balance volume together as a momentum-trend check of whether buying or selling predominates inside the range.
- Agreement between the two volume-flow lines is treated as stronger confirmation. Opposite trends are a reason to stand aside.
A resistance-support area is the price band between a ceiling-like resistance wall and a floor-like support wall. Repeated tests of those walls can look decisive while price is still boxed. The archive workflow then checks two running volume totals before a later departure is described as buyers outnumbering sellers, or sellers outnumbering buyers.
Start with the walls of the box
A resistance area is a ceiling-like price zone that repeated upside tests fail to clear for a time. A support area is the counterpart zone that repeated downside tests fail to break. After enough tests, price often finally leaves the zone.
The band between those two areas is treated as a resistance-support area. A departure from it is described as occurring either after more tests of one boundary than the other, or when buyers outnumber sellers on an upside break, or when sellers outnumber buyers on a downside break.
In the General Electric daily example, price tested the 54.5 area six times from late March through late July and cleared it on a seventh attempt dated August 9. Volume after the first late-March test did not show lasting dominance by either side.
A test count is not a standalone rule
Counting tests is not treated as a reliable standalone rule. The same stock later made several attempts above 48 in January and February 2001 and then declined to 37.7 on March 22.
Read the two volume-flow lines inside the box
The accumulation-distribution line accumulates volume from where the session close sits between that session high and low. On-balance volume accumulates volume from whether the close is above or below the prior close. Both add a positive amount when price rises and a negative amount when price falls, and both rise when buying predominates.
While Microsoft traded inside a September to November 1999 resistance-support area, the accumulation-distribution line was in an uptrend, which is read as net buying even though price stayed range-bound.
For General Electric in January and February 2001, both the accumulation-distribution line and on-balance volume were in downtrends while price stayed in a narrow range, which is read as sellers dominating buyers.
Use momentum-trend agreement as the second step
The two volume-flow lines are used together as momentum-trend confirmation. Momentum-trend means whether the accumulation-distribution line or on-balance volume is rising or falling. Agreement is treated as stronger, one trending line against a flat companion is treated as weaker, and opposite trends are treated as a reason to stand aside.
As an editorial label for that workflow, the later General Electric range is the emptied-box case: both lines were in downtrends while price stayed boxed. The Microsoft band shows net buying on the accumulation-distribution line while price stayed range-bound, without a paired on-balance volume reading in the same sequence. The drill still waits for both lines before treating the next break as a directional call.
A broken wall can change its role
A former resistance area can later act as support, and a former support area can later act as resistance. That level-role-reversal shows up in a later General Electric sequence: accumulation near the top of a band, a sudden high-volume decline through support, then profit-taking and loss-cutting that kept price from exceeding that former support.
In that later rebound window, on-balance volume declined while the accumulation-distribution line went flat, and the falling on-balance volume was not dismissed.
Editorial close: when one line trends and the companion is only flat, the confirmation is weaker, but the trending line is still in force. Opposite momentum-trends remain a reason to stand aside rather than to treat the next departure from the resistance-support area as a directional call.
GE daily price fails the 48 box and breaks to 37.7
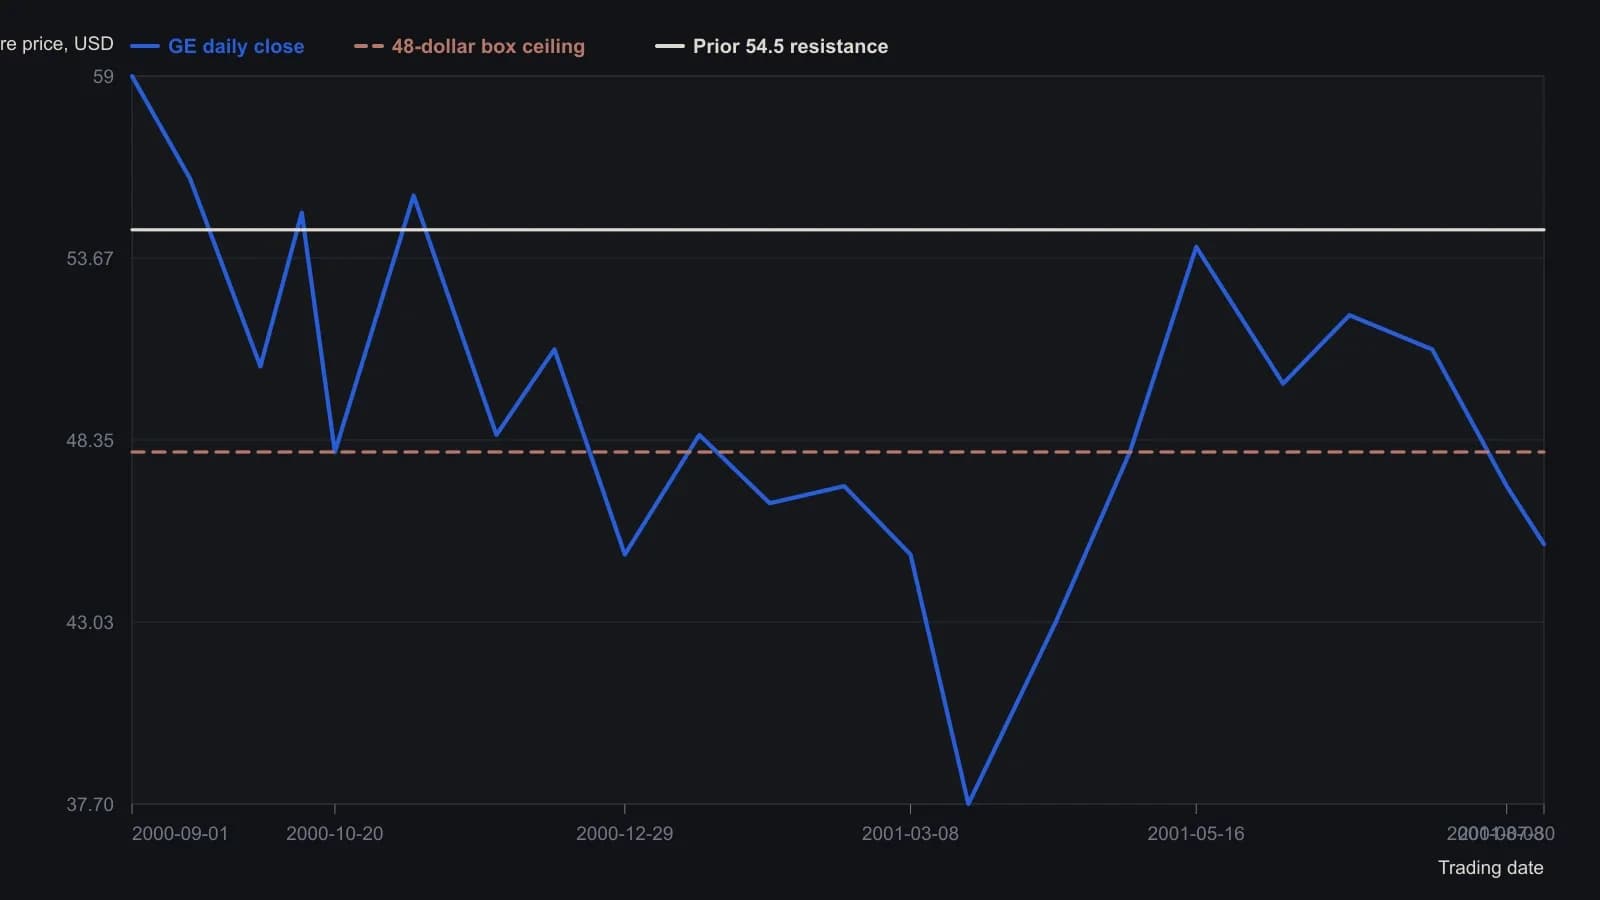
Closes between the labeled 40/45/50/55/60 grid were read to the nearest half-dollar except for the 37.7 March 22 print and the 45.3 last quote on the figure. On-balance volume and accumulation/distribution sit on separate panes of the same figure and are not mixed onto this price scale.
All readings on this track · 8 readings
- 1995Constructing an accumulative swing index from open-high-low-close comparisons
- 2001Confirming a price-box break with on-balance volume and the accumulation-distribution line
- 2004Why on-balance volume and the accumulation-distribution line disagree
- 2006Lagged commercial nets and a weekly accumulation trigger
- 2007Constructing dominant cycles from participant accumulation
- 2011Linear regression overlays on volume-flow primaries
- 2014Lookalike money flow is not on-balance volume
- 2015Volume-free accumulation and a next-session bias overlay