1995issue C111-4
Constructing an accumulative swing index from open-high-low-close comparisons
Swing coding compresses a session's open, high, low, and close, together with the prior session, into one bounded daily score. That daily swing index is too volatile to stand alone. The chartable object is the running accumulation-distribution line built from those scores.
- A continuous trend line can be built by comparing open, high, low, and close within a session and against the prior session, rather than by using close-to-close change alone.
- Swing coding collapses five weighted relations onto a scale from +100 to -100, producing a daily swing index that is highly volatile and of little standalone use.
- The accumulative swing index is the running total of those daily scores. It is less volatile than the daily series and still tracks the price chart closely enough that the same chart readings can be applied to it.
- When a market has no daily price limit, the construction substitutes a very large dollar figure for the limit-move scaler.
Four prices, two sessions
A session is defined by open, high, low, and close. A continuous trend line can be built by comparing those four prices within the session and against the prior session, rather than by using close-to-close change alone.
Swing coding is the conversion of those intra-session and day-to-day open-high-low-close relations into a single signed daily score on a bounded scale.
Twenty-eight comparisons
Cross-session pairing of yesterday's and today's open, high, low, and close produces 16 comparisons. Each of the two sessions also contributes 6 intra-day comparisons, for 28 comparisons in all.
Five relations on an up day or a down day
Five relations were treated as the most indicative on an up day: today's close above yesterday's close, today's close above today's open, today's high above yesterday's close, today's low above yesterday's close, and yesterday's close above yesterday's open. The same relations with below define a down day and take negative values.
The five weighted comparisons are collapsed onto a scale from +100 to -100. The value +100 is assigned to a limit-up day after a prior limit-up day, -100 to a limit-down day after a prior limit-down day, and zero to an unchanged session after an unchanged session.
Writing the daily swing index
The daily swing index is the volatile one-day score produced by the weighted comparison before any accumulation. It is written as 50 times a bracket that contains the close-to-close change, half of today's close-to-open change, and one-quarter of yesterday's close-to-open change divided by R, then scaled by K over T.
The K factor is the larger absolute excursion of today's high or today's low from the prior close, taken as the larger absolute value of today's high minus yesterday's close and today's low minus yesterday's close. T is the limit move, the one-direction daily price constraint used as the T scaler.
The R factor is the range normalizer. It is chosen by which of today's high versus prior close, today's low versus prior close, and today's high-low range has the largest absolute value, then computed with the matching one of three expressions that mix that dominant range with a half-weight on the opposite excursion and a quarter-weight on yesterday's close-to-open change.
The daily score is not the chart
Used alone, the daily swing index is described as highly volatile, with a tendency to spike through the zero line between the +100 and -100 extremes. It is treated as of little standalone use.
The running total as the chartable object
The accumulative swing index is the running total of daily swing-index values, adding positive readings and subtracting negative ones. It is described as less volatile than the daily series while still tracking the price chart closely enough that the same chart readings can be applied to accumulative-swing-index points instead of price points.
That running total is the accumulation-distribution line: the chartable object used in place of the raw price series.
When a market has no daily price limit, the construction substitutes a very large dollar figure for T. One suggested magnitude is on the order of 30000 dollars.
May 1995 corn and the accumulative swing index
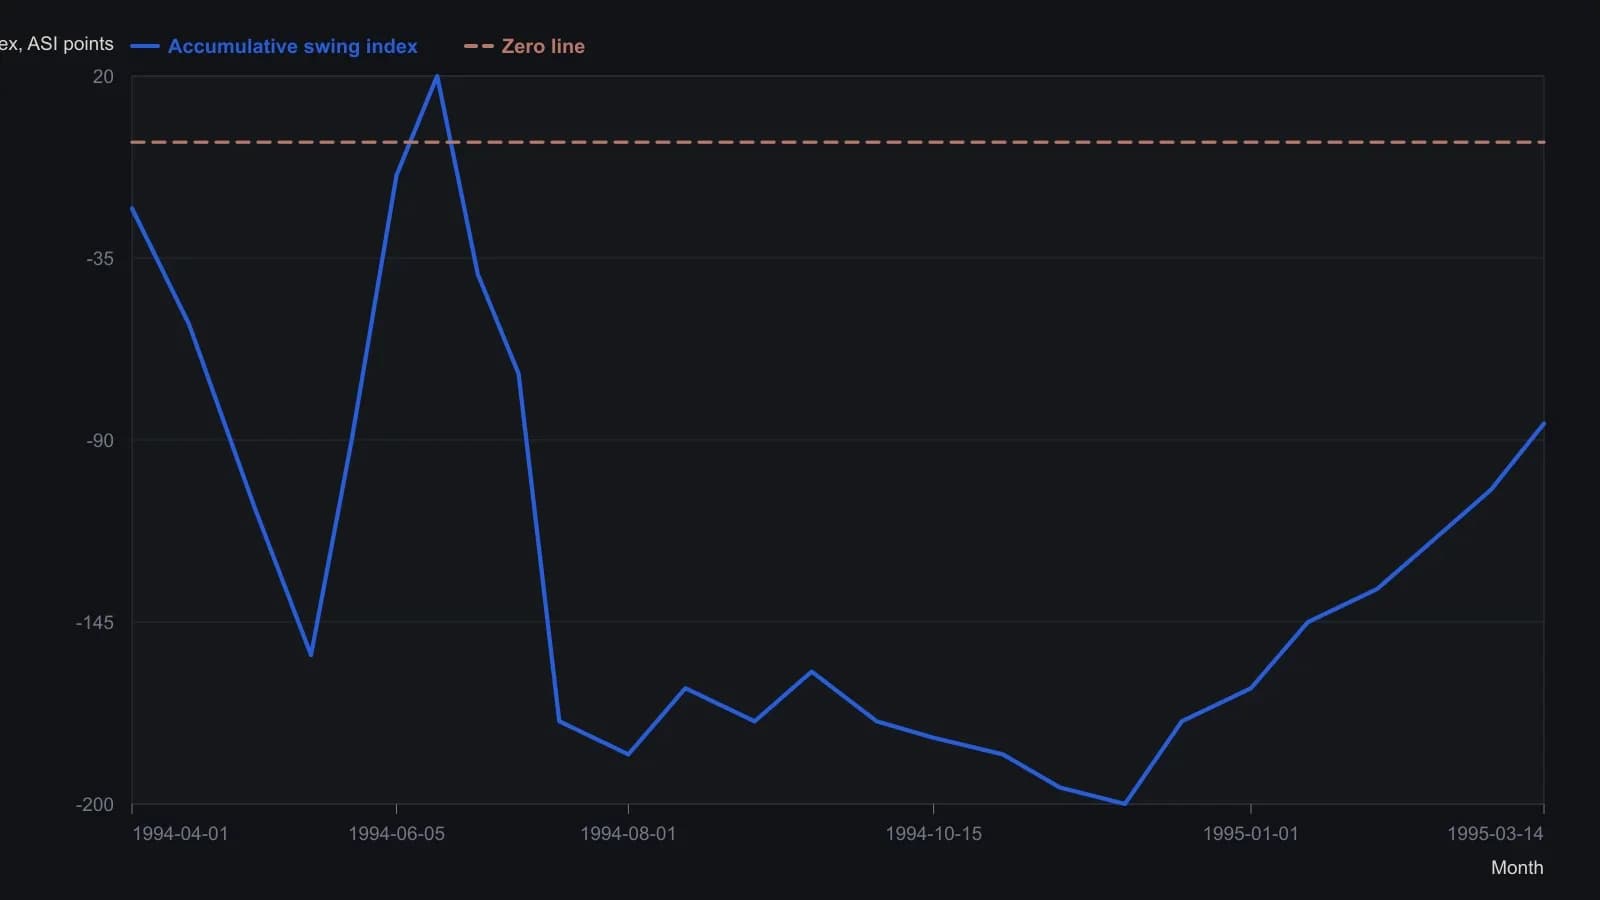
Values are approximate readings from the printed MetaStock screenshot (April 1994–March 1995). The daily swing-index formula is bounded ±100; this series is the running sum of those daily scores. Corn prices sit in a separate pane and are not plotted here.
All readings on this track · 8 readings
- 1995Constructing an accumulative swing index from open-high-low-close comparisons
- 2001Confirming a price-box break with on-balance volume and the accumulation-distribution line
- 2004Why on-balance volume and the accumulation-distribution line disagree
- 2006Lagged commercial nets and a weekly accumulation trigger
- 2007Constructing dominant cycles from participant accumulation
- 2011Linear regression overlays on volume-flow primaries
- 2014Lookalike money flow is not on-balance volume
- 2015Volume-free accumulation and a next-session bias overlay