2002issue C091-3
Classify a weak-dollar regime before overseas sales and index proxies
A 2002 currency-equity episode is taught here as a three-step portfolio-context drill. Classify the home-currency regime on intermarket charts, translate it through overseas-sales mix, and only then test whether home and foreign index proxies confirm the same regime.
- Treat a stalled dollar bounce beside a domestic equity high as a regime clue, not as a standalone currency call.
- Use intermarket-analysis first: read the home currency against inflation, rates, and equities, and separate a stabilizing-correction from an inflation-shock overshoot.
- Apply currency-translation only after that classification, using overseas-sales-mix to see which firms could benefit if foreign buyers remain willing.
- Use an index-proxy last to check whether an overseas vehicle, a US-based global fund, and the S&P 500 experienced the same dollar breakdown.
A high stock beside a weak bounce
A mid-May 2002 comparison placed a US discount-retail equity at a 52-week high on the same day the US dollar managed only a limited bounce from a roughly 30-week low. The currency side of that comparison was still described as globally used, but under pressure from corporate debt, weaker profits, and the prospect of government deficit spending.
Editorial framing for this archive: do not stop at the dollar as a directional call. The rest of the case is a three-step portfolio-context drill. First classify the home-currency regime on intermarket charts. Then translate that regime through overseas-sales mix. Only then test whether home and foreign index proxies confirm the same regime.
First, classify the home-currency regime
Dollar-decline warnings were already circulating around a late-2000 peak that coincided with the Nasdaq 42 percent below its high and the S&P 500 12 percent below its high. Those early warnings were not confirmed immediately. The dollar rebounded in late 2000, made a higher high in mid-2001, and peaked again before the end of 2001.
In 2002 the US dollar index was described as weakening from early spring into summer, with a descending-triangle-like pattern across February through April and a bearish flag in early May that preceded further losses. A late-May 2002 official purchase of dollars was presented as an attempt to halt a slide and protect a fragile recovery, not as profit-seeking demand.
A stated intermarket chain treated a firm currency as usually associated with low inflation and lower interest rates, and treated that mix as typically supportive for equities outside a major deflationary episode. The same case framed a lower dollar as potentially constructive if it only unwound late-1990s overvaluation, but as a financial-sector inflation shock if the move overshot a stabilization path.
Editorial reading of intermarket-analysis: a home-currency move is judged against equities, inflation, and rates so one position sits inside a broader market regime. The 2002 charts are the place to ask whether the decline looks like a stabilizing-correction, meaning a retreat from prior overvaluation, or an open-ended slide that reintroduces inflation risk.
US Dollar Index, January–May 2002
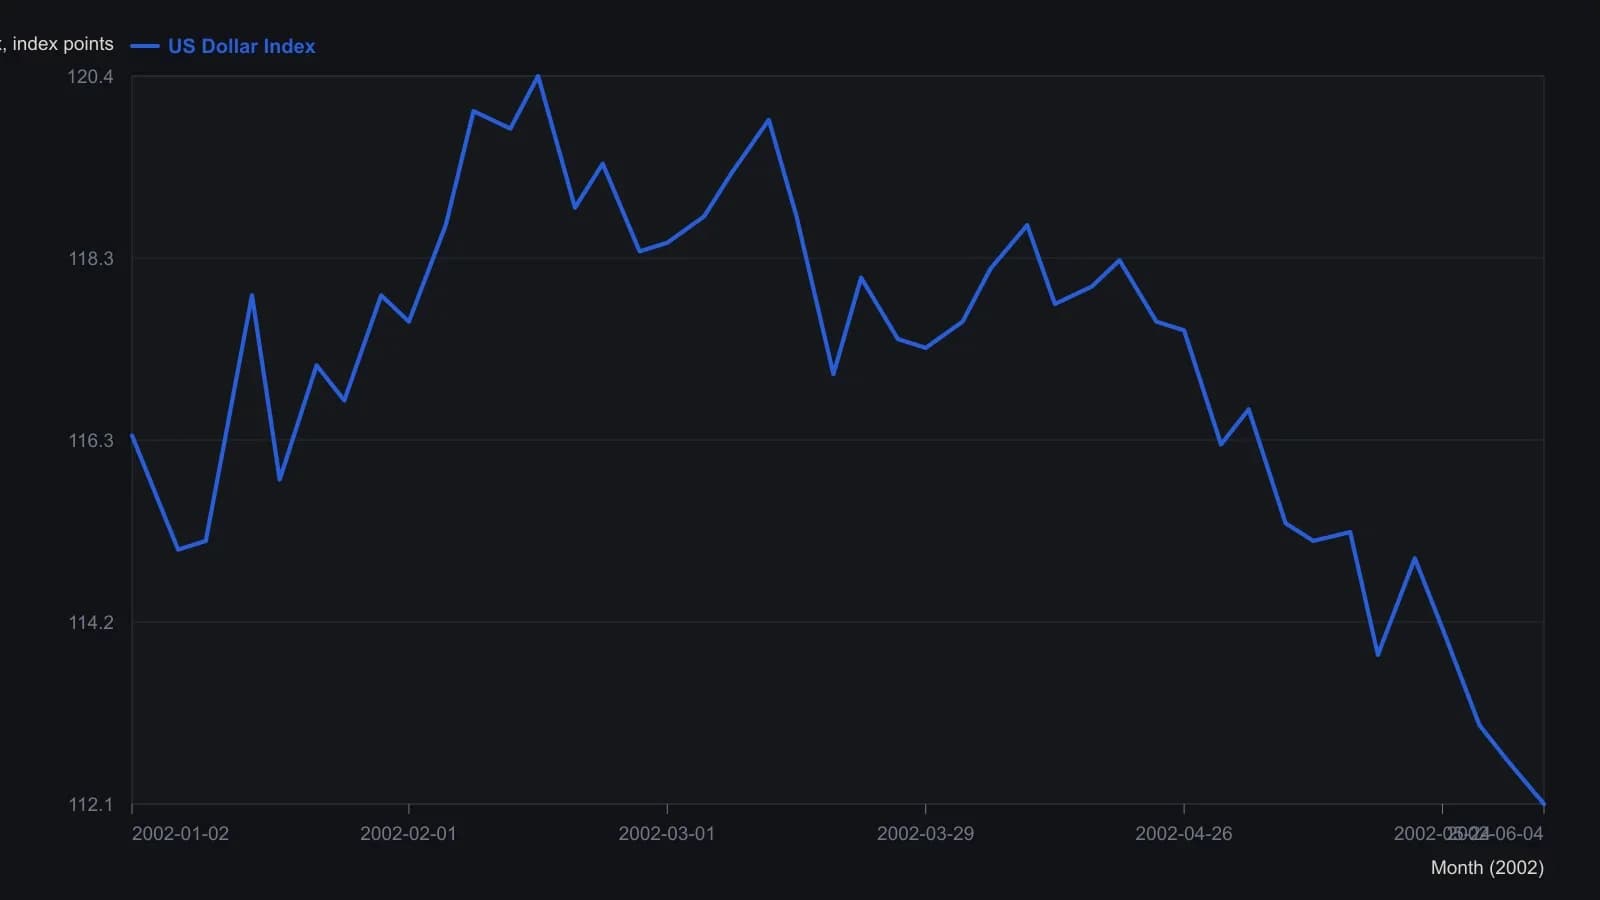
Y-values are approximate readings from the raster (half-point ticks). The last print in the window title is 112.10 on a −0.70 session. Pattern lines on the source pane are not series.
Then translate the regime through overseas-sales mix
Firms with large overseas sales were described as possible beneficiaries of a milder inflationary, weaker-dollar climate because home-currency goods become cheaper abroad if foreign buyers remain willing. Two examples had about 70 percent and 60 percent of sales overseas.
Editorial reading of currency-translation: a weaker or stronger home currency changes the competitiveness and reported results of firms that earn a large share of sales abroad. Overseas-sales-mix is that share of revenue earned outside the home market. This step comes after regime classification because a milder stabilizing-correction and an overshoot that becomes a financial-sector inflation shock do not reach those firms in the same way.
Only then check index proxies
A fund-level index-proxy comparison showed leadership shifting to an overseas-company vehicle versus a US-based global fund and the S&P 500 only after the dollar broke down in mid-April 2002.
Editorial reading of an index-proxy: a home benchmark, a global or overseas fund, and a dollar index stand in for how different portfolios experience the same currency regime. In this case the proxy shift arrived after the mid-April breakdown. That is a confirmation check, not a substitute for classifying the dollar first and then reading overseas-sales mix.
All readings on this track · 25 readings
- 1989Constructing currency-translated commodity bars
- 1992Gold, the dollar, and a foreign-currency proxy
- 1993Overseas fund translation after the European currency break
- 1995Inflation-ratio overlays, peso breaks and election cycles
- 2002A liquidity filter and intermarket overlay for one currency setup
- 2002Classify a weak-dollar regime before overseas sales and index proxies
- 2003A currency pair as a regime spread with trend and leverage bounds
- 2005Score a currency position as a cross-market portfolio
- 2005CAD/JPY as an oil translation: correlation, carry, and portfolio role
- 2006Placing a currency trade inside a gold, oil, and yield regime
- 2006Classifying the yen regime after Japan's liquidity exit
- 2006Two horizons in the 2006 euro-dollar advance
- 2007Rolling-window tests for gold hedge slogans
- 2010Stacking commission and currency costs on international fills
- 2010A dollar-pivot intermarket regime for currency pairs
- 2010Constructing currency pairs from basket relative strength
- 2012Same-way versus opposite-way currency pair construction
- 2012Signed two-currency session spread construction
- 2012A two-pass reading of listed currency sleeves
- 2013Closed foreign futures still leave a leftover currency line
- 2014Forex pair ranks from seven cross-currency scores
- 2015Currency translation across rate and trade regimes
- 2015Ten-year policy phases and FX capital-flow regimes
- 2016A peaking dollar and the commodity as a two-market case
- 2017S&P 500 energy gauge as a short-horizon regime filter