1994issue C091-10
Stacked candlestick confirmation on Malaysian indexes, 1994
The 1993 to 1994 Malaysian index episode is a case in stacked confirmation. A location-qualified umbrella-line stays a hypothesis until a later anaume, dark-cloud-cover, or bearish-engulfing bar, and a matching structure on a related index, makes the reversal claim testable.
- A black long-lower-shadow candle is a hammer at a decline low and a hanging-man at a rally high. Shape alone does not finish the reading.
- When several candlestick structures overlap, the case treated them as extra support for one directional hypothesis, not as separate independent signals.
- A later anaume, dark-cloud-cover, or bearish-engulfing bar is what made an earlier umbrella-line testable.
- Related Malaysian indexes printing similar reversal structures in the same window added a second check on the same claim.
A recorded high after a long advance
A Malaysian composite of 85 large-capitalization equities reached a recorded high of 1,332 on 5 January 1994 after a bull phase dated from August 1992.
A weekly black hammer near the end of August 1992 was presented as the first candle hint that the advance was starting. A later black hammer in February 1993 was presented as marking another advance.
An umbrella-line needs a location-rule
An umbrella-line is a long-shadow candle whose meaning is incomplete until its place in the trend is known. The family includes the hammer, hanging-man, inverted-hammer, and shooting star.
Hammer and hanging-man readings depend on both shape and location. The same long-lower-shadow black body is a hammer at a decline low and a hanging-man at a rally high when the lower shadow is at least twice the real-body length and the close is below the open.
The location-rule classifies a candle twice: by where it sits in the current trend, and by how it compares with the immediately prior candle. A later bar can change that reading.
Overlap supports one directional claim
When more than one candlestick structure is present at the same time, the case treated the overlap as extra support for a single directional hypothesis rather than as separate, independent signals.
KLSE Composite through the January 1994 high
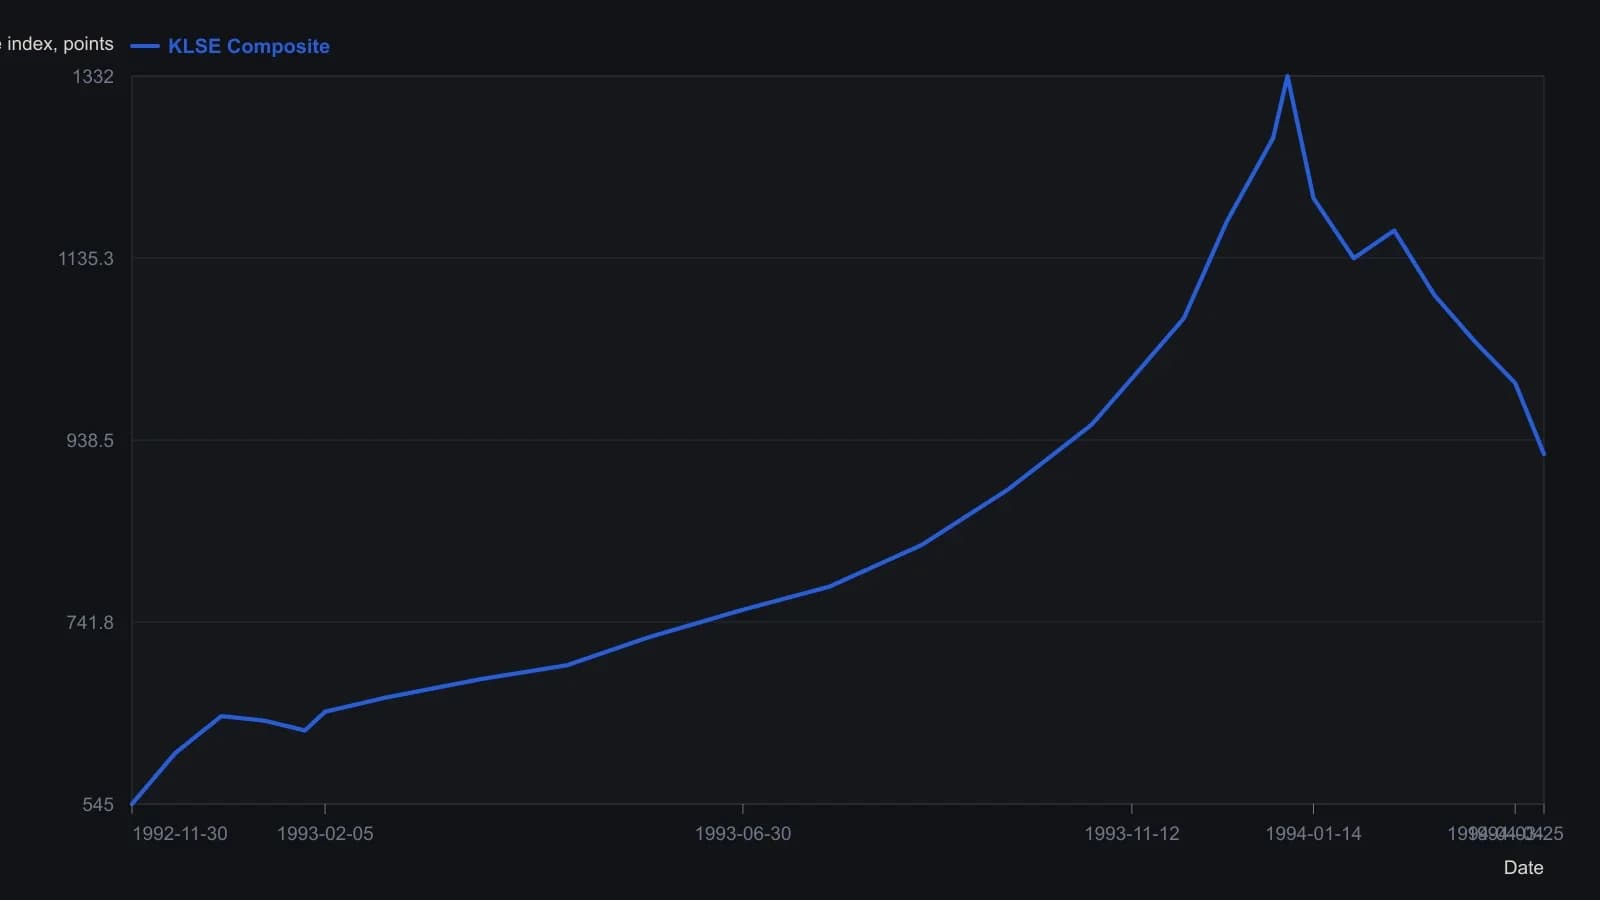
Interior points are raster readings rounded to 5 index points from a daily candlestick pane (vertical tick 165 points). They are not official settlements. Three OHLC snapshots on the figure and the stated 1,332 high are carried at the source’s own precision.
A gap-fill after the February hammer
After the February 1993 black hammer, a long white candle completed a five-bar gap-fill, called anaume. The sequence is a gap after the first two candles, two bars that stay below that gap, then a fifth bar that fills it. It was read as exhaustion of the preceding minor decline.
A downside-gap sequence on the broad index
On 15 January 1993 the 350-share broad index printed a black hammer that gapped under the prior black candle inside a three-black downside-gap sequence.
That bullish-black-two-gaps sequence is three successive black candles that each gap lower. It is treated as complete if a later white candle fills the last gap.
A dark-cloud-cover at the composite high
A weekly dark-cloud-cover around 7 January 1994 paired a long white bar with a next bar that gapped then closed below the prior midpoint. The second open can mark interim resistance.
A black hanging-man that closed under the pattern lows was used to mark the 1,332 composite high as a peak.
Related indexes in the same window
Between 5 and 7 January 1994 several related Malaysian indexes printed bearish reversal candles together. The 350-share broad index showed a dark-cloud-cover, while consumer-product and industrial-product groups showed incomplete versions of the same structure.
New-price runs and bearish-engulfing bars
Daily finance and plantation indexes each showed an eight-to-ten new-price-line sequence. Eight-new-price-lines are scored from successive session highs or lows rather than from open-close relationships. After that run, a confirming reversal candle was required.
The plantation daily chart ended that new-price run with a black candle that engulfed the prior white candle, a bearish-engulfing confirmation. The finance index was marked two days later by an engulfing black candle on the weekly chart.
Editorial reading of stacked confirmation
Editorial reading: the first umbrella-line in this episode is not treated as a finished reversal. The claim becomes testable only after a later bar fills a gap, completes a dark-cloud-cover, or posts a bearish-engulfing body. A matching structure on a related index is a preferred second check, not a separate trade idea.
All readings on this track · 16 readings
- 1991Candlestick stops from confirmation and engulfing
- 1994Stacked candlestick confirmation on Malaysian indexes, 1994
- 2001Two-bar candlestick reversal as a timed construction
- 2002Engulfing reversal needs trend and a trailing stop
- 2003Engulfing geometry needs a swing slope referee
- 2004Constructing stops from candle control levels
- 2007Abstention completes the engulfing system
- 2007Constructing the belthold candlestick signal
- 2008Evaluating engulfing reversals with opposite-exit tests
- 2010Candle names as a filter, not a catalog
- 2012Critiquing engulfing and volume patterns as crowd psychology
- 2012Candlestick construction of bullish engulfing and a paper-trading rehearsal
- 2015Reading engulfing candles in context
- 2018Treat a bullish engulfing as unfinished work
- 2019Evaluating bullish engulfing with context filters
- 2020Eight-bar pause reclaim entry and a stop-target grid