2002issue C061-4
A staged reading from long-shadow hammer to engulfing
Frequent long-shadow candlestick-patterns are treated as statistically weak on their own. This case marks support first, treats a hammer at that map as an event alert, then waits for confirmation or a later engulfing before calling the level defended.
- Long-shadow, short-body candlestick-patterns such as hammers, hanging men, and stars appear throughout trends and ranges, so they are treated as statistically weak when used alone.
- Those frequent bars still matter when they form at a pre-marked support area or around a discrete news shock.
- A candlestick-hammer is an event alert that still wants confirmation: a higher open and still-higher close on the next session, treated here as lower risk than acting on the first long-shadow bar.
- A later candlestick-engulfing is presented as stronger two-session follow-through and is often used without that extra verification.
Mark support before the candle
Long-shadow, short-body candlestick-patterns such as hammers, hanging men, and stars appear throughout trends and ranges. Used alone, they are treated as statistically weak.
Those frequent candlestick-patterns are still treated as useful when they form at a decisive location or around a discrete news shock. A pre-marked support area is what gives a common long-shadow bar a decision context.
Editorial: TradersWeek reads this as a staged sequence, not a one-bar call. Mark support first. Treat a candlestick-hammer at that map as an event alert. Step up to later confirmation or a candlestick-engulfing before calling the level defended.
Prepare more than the candle map
Chart preparation combined candlestick-patterns with a volume-flow oscillator, trend channels, support and resistance, moving-average convergence/divergence, and a broad-index comparison. Repeatable OHLC formations were used as day-to-day signals only after that broader setup existed.
After a decline from a peak near 47, a support line near 35 was marked as the next decision area for watching daily candlestick-patterns.
The inverted hammer is an event alert
On 5 February 2002, price broke below that 35 area on a leasing-finance news shock, printed a session low of 33.0 against an open of 35.5, then recovered into a forming inverted candlestick-hammer.
A candlestick-hammer is framed as a downtrend session that sells off sharply and then returns toward the high, leaving a long lower shadow and a small body. A higher open and still-higher close on the next session is the stated confirmation rule.
Waiting for that next session was treated as lower risk than acting on the first long-shadow bar. Editorial: TradersWeek keeps the inverted hammer in the alert slot. The rejected excursion printed at a pre-marked support line after a discrete news shock, which is why the bar is worth watching, not why it stands alone.
Later engulfing and a held support line
About two weeks later the 35 area still held. The 5 February candlestick-hammer opened a multi-day run of higher white closes, and a later rebound from near that support formed a candlestick-engulfing pattern.
On 19 February price broke the downward trendline and then looked consolidative. The fast rebound after the news shock was read as a temporary event reaction rather than a lasting business-quality break.
Editorial: TradersWeek treats the later candlestick-engulfing and the multi-day run of higher white closes as the follow-through that lets a reader call the support area still in play. The first long-shadow bar remains only the opening alert, and the archive caution about a temporary event reaction stays attached to that first session.
KKD daily closes versus the $35 support
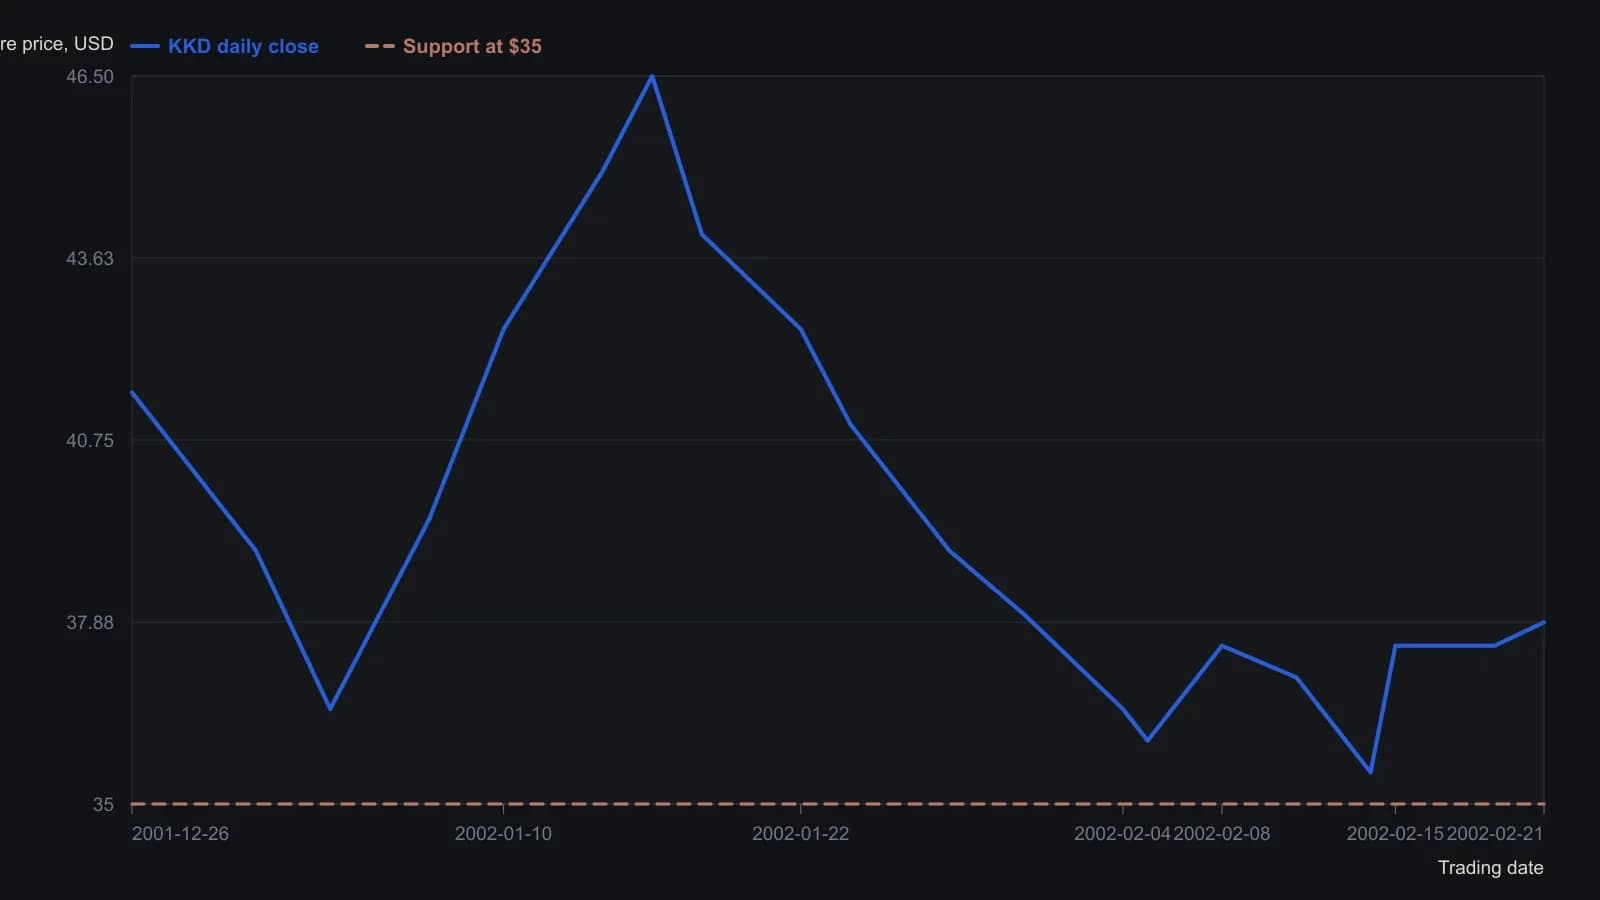
Closes are approximate readings from the published daily grid at about half-dollar resolution. Hammer (5 Feb) and trendline-break (19 Feb) dates follow the article. The 5 February intraday low of $33 is stated in the text but sits below this pane, so the series uses the visible close, not that low.
All readings on this track · 8 readings
- 1992Constructing candlestick reversals from body, shadow, and trend location
- 2002A staged reading from long-shadow hammer to engulfing
- 2003Constructing a hammer from a failed breakdown
- 2004Hammer and hanging-man bars still need context and confirmation
- 2004Strength-rated hammer candlestick construction
- 2004Treat every paper umbrella as a timed experiment
- 2008Weekly engulfing, hammer, and soldier reversals as a control test
- 2018RSI, hammer, and moving-average gates for range hypotheses