2012issue C0640-42
Critiquing engulfing and volume patterns as crowd psychology
Engulfing candles and volume-backed boundary tests are graded psychological hypotheses. They earn attention when inbound exhaustion, candle span, and participation can be specified, and they lose it when the same geometry is only a crowded script or an automated cascade.
- Candlestick patterns, including a bullish engulfing after an extended decline, are hypotheses about a shift in buyer-seller control. The covering candle opens lower, fully covers the prior falling candle, and is read as sellers losing control.
- Volume-price analysis grades boundary tests, including triangle ceilings and engulfing bars, by whether participation shrinks while a level holds and expands if resistance later breaks.
- Pattern quality is judged from a formation's own span, volume, inbound trend, and psychological completeness rather than from its label.
- Widely watched moving-average crossovers, MACD-type oscillator signals, and support-resistance breaks can become self-reinforcing through herd following, informational cascades, and automated entry-exit triggers.
Chart conditions as hypotheses
As a TradersWeek editorial matter, engulfing candles and volume-backed boundary tests are graded psychological hypotheses, not named magic. A pattern earns attention only when inbound exhaustion, candle span, and participation can be specified. It loses that attention when the same geometry is just a crowded script or an automated cascade.
In the historical workflow, candlestick patterns are repeatable open-high-low-close arrangements used as hypotheses about a shift in buyer-seller control. They are judged by inbound trend, span, and follow-through conditions.
A pause that tests a ceiling
The historical workflow specifies an ascending continuation triangle as a pause after a rising inbound trend, with at least two higher lows and repeated failures to break a near-horizontal resistance line while participants test that price level.
While that triangle is forming, buyers are described as refusing to pay through resistance, existing holders as remaining bullish, and volume as shrinking if the ceiling continues to hold. Volume-price analysis reads whether participation expands or contracts as price tests that boundary.
As price nears a possible apex, shorter pivot ranges and fading volume are said to build pressure for a larger move either way. A later resistance break is tied to a significant volume increase and a shift in the supply-demand regime.
Steven Madden daily share price with 2011 triangle breakout
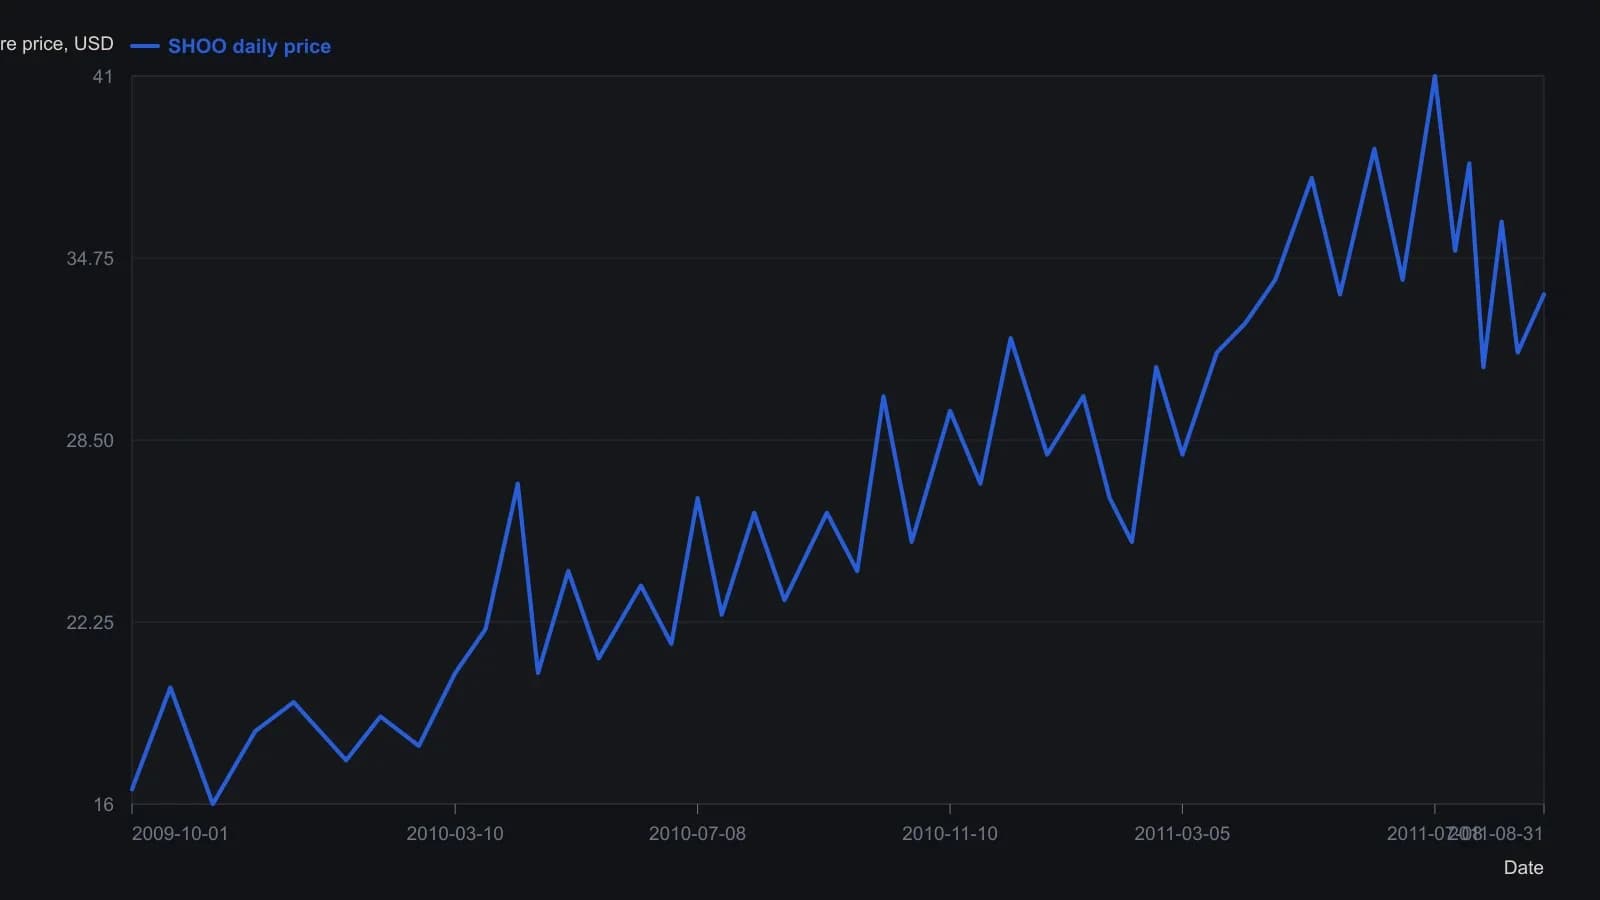
Prices were read from the printed dollar grid; session dates were inferred from the month labels, so both level and timing are approximate.
An engulfing candle as a reversal hypothesis
A bullish engulfing candlestick pattern is defined as a short-term reversal after an extended decline. It begins with a lower open and finishes as a rising candle that fully covers the prior falling candle, taken to mean that sellers have lost momentum.
In that engulfing reading, substantial volume on the covering candle, a larger length relative to the prior falling candle, and coverage of more than one prior candle are treated as markers of greater buyer commitment. Volume-price analysis applies the same participation test to those covering bars.
When many people act on the same condition
Widely watched moving-average crossovers, MACD-type oscillator signals, and support-resistance breaks can generate self-reinforcing price moves simply because many participants act on the same condition.
Herd following, including informational cascades in which people discard their own reading to follow the crowd, and automated entry-exit triggers, are presented as amplifiers of those cascades. An informational cascade is a crowd episode in which participants set aside their own reading and follow the visible majority. Exchange circuit breakers are described as a control on that herding.
TradersWeek editorial view: once a chart condition is mainly a widely watched trigger, the geometry no longer carries the same psychological information as a completed inbound trend, a specified span, and a volume test.
Judge the formation, not the name
Pattern quality is to be judged from a formation's own geometric and volume attributes and from the psychological drivers that produce them, rather than from treating chart geometry as occult.
Editorial restatement: judge a formation from its own span, volume, inbound trend, and psychological completeness rather than from its label.
All readings on this track · 16 readings
- 1991Candlestick stops from confirmation and engulfing
- 1994Stacked candlestick confirmation on Malaysian indexes, 1994
- 2001Two-bar candlestick reversal as a timed construction
- 2002Engulfing reversal needs trend and a trailing stop
- 2003Engulfing geometry needs a swing slope referee
- 2004Constructing stops from candle control levels
- 2007Abstention completes the engulfing system
- 2007Constructing the belthold candlestick signal
- 2008Evaluating engulfing reversals with opposite-exit tests
- 2010Candle names as a filter, not a catalog
- 2012Critiquing engulfing and volume patterns as crowd psychology
- 2012Candlestick construction of bullish engulfing and a paper-trading rehearsal
- 2015Reading engulfing candles in context
- 2018Treat a bullish engulfing as unfinished work
- 2019Evaluating bullish engulfing with context filters
- 2020Eight-bar pause reclaim entry and a stop-target grid