2020issue C0340-44
A Nasdaq-100 proxy as a construction problem, not a ticker
A Nasdaq-100 proxy is a concentrated technology-and-consumer basket, not a stand-in for the full Nasdaq listing universe. Concentration, an equal-weight sibling, and a simple trend overlay change what that single trade represents across bull and bear regimes.
- A Nasdaq-100 proxy holds only the largest nonfinancial Nasdaq names and is a concentrated technology-and-consumer basket, not a stand-in for the full Composite listing universe.
- Market-capitalization weighting left a few mega-cap names with a large share of late-2019 Nasdaq-100 weight, while equal-weighting holds the same 100-name universe without letting those names set most of the path.
- From 1999 to 2019 the proxy or the Composite outpaced the S&P 500 and Dow in eleven years, with large advances and deep declines, so the same trade can be a bull-regime vehicle or a drawdown vehicle.
- A trend-following overlay that switched among full investment, a 50/50 mix with Treasury bills, and a full Treasury-bill stance produced the lowest group standard deviation and the weakest 2019 gain among the compared funds.
A construction problem, not a ticker
A Nasdaq-100 proxy holds only the largest nonfinancial Nasdaq names. It is a small slice of the broader Composite, so it is a concentrated technology-and-consumer basket rather than a stand-in for the full Nasdaq listing universe.
An index proxy is a listed fund or basket used as a stand-in for an index so a single position can be compared with other market averages and sibling funds. Editorial: the popular vehicle is better read as that construction object, not as a ticker that already answers what the trade represents.
Concentration inside market-capitalization weighting
At the late-2019 snapshot, both the Composite and the Nasdaq-100 were dominated by technology, with communications or consumer services as the next-largest sleeve. Materials, energy, and utilities were absent from the Composite's top sectors.
A few mega-cap names carried a large share of Nasdaq-100 weight at that date. Market-capitalization weighting sizes holdings by company size, so a few large names drive most of the basket's path. The capitalization-weighted proxy is therefore also a concentration bet on those holdings.
The source frames the Nasdaq-100 proxy as less diversified and more volatile than the S&P 500, the Dow, and even the Composite because of its smaller roster and heavy technology and consumer concentration.
Equal-weighting as a sibling construction
An equal-weight Nasdaq-100 sibling exists as a direct construction contrast. Equal-weighting assigns similar weight to each constituent so mega-cap names no longer dominate index returns.
The same 100-name universe can be held without letting the largest stocks set most of the path. Editorial: that sibling separates the 100-name roster from the mega-cap concentration bet.
Bull and bear regimes around one path
Across the 1999 to 2019 calendar-year table, the Nasdaq-100 proxy or the Composite outpaced the S&P 500 and Dow in eleven years. Those years include large 1999, 2003, 2009, and 2019 advances and deep 2000 to 2002 and 2008 declines.
Price-only cumulative paths in the source show the Nasdaq-100 proxy ahead of the Composite, Dow, and S&P 500 from early 1999 through 2019, and still further ahead from the March 2009 low through 2019.
Editorial: regime-aware context means placing one trade beside broader averages and alternative weightings to see whether the result is a technology bull, a concentration bet, or a drawdown vehicle. The same proxy can be each of those things in different stretches of the table.
A trend-following overlay on the same proxy
Trend-following is a rules-based procedure that moves a portfolio between full exposure, partial exposure, and cash-like holdings as a long moving-average condition changes.
One rules-based overlay compared the Nasdaq-100 with its 200-day average and switched among full investment, a 50/50 mix with Treasury bills, and a full Treasury-bill stance. Among the compared funds, that overlay produced the lowest group standard deviation and the weakest 2019 gain.
Editorial: the overlay does not change the underlying roster. It changes how much of that concentrated basket is held when the long average condition changes.
A levered index vehicle is a different object
A daily levered index vehicle is presented as amplifying both advances and declines relative to the unlevered proxy, including a much larger drawdown in the illustrated decline. The source reserved that product for experienced traders with explicit risk limits.
Editorial: leverage is not another weighting scheme. It scales daily index moves and can enlarge both sides of the same concentrated path.
Cumulative price change: QQQ versus major averages, 1999–2019
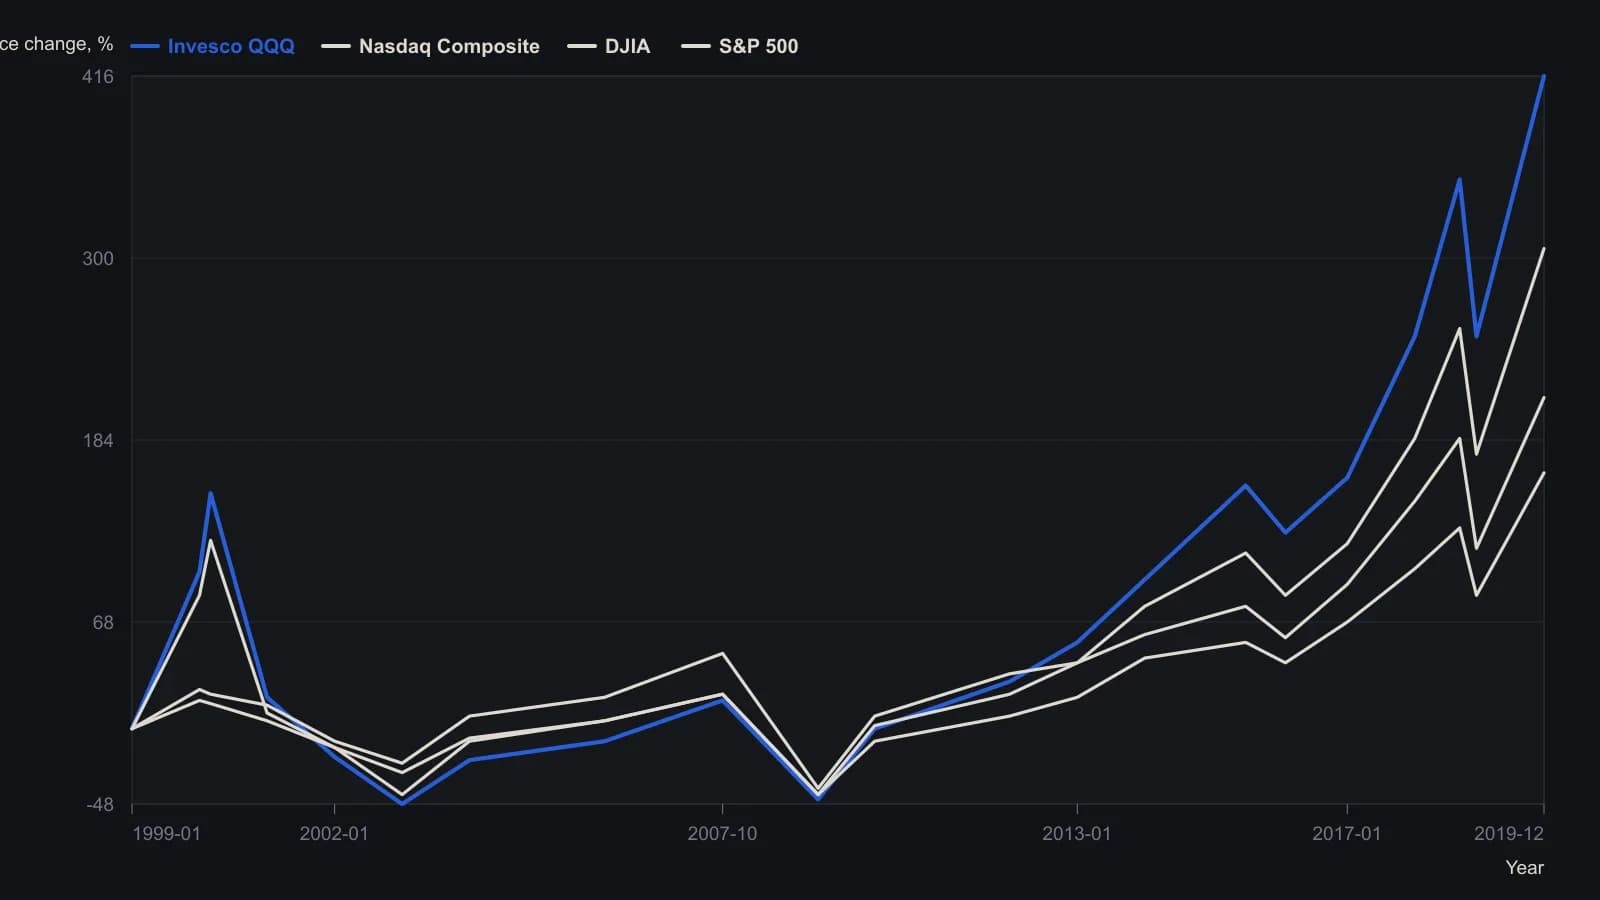
The source plotted price change without dividends. The 4 January 1999 QQQ level was back-calculated from index members because the fund listed on 10 March 1999. Intermediate points are read from the raster to the nearest few percent.
All readings on this track · 10 readings
- 1992Evaluating equity sleeves against an index-proxy cost drag
- 1996Match a technology position to an index-proxy, then to a listed futures contract
- 2001Equal-weight pictures, rank rotation, and regime-aware allocation
- 2005Listed index baskets as allocation sleeves
- 2016A 9/36 inflation state for a commodity and dollar basket
- 2016Liquidity filters, weighting rules, and index proxies in a same-category sleeve
- 2018Values-screened ETF sleeves as an allocation case study
- 2019Equal-weight rank-rotation tests for a disclosed value book
- 2019High-dividend-paying ETFs as a portfolio-construction choice
- 2020A Nasdaq-100 proxy as a construction problem, not a ticker