2001issue C051-6
Equal-weight pictures, rank rotation, and regime-aware allocation
A historical ranking case shows how an equal-weight market picture, sequential rank buckets, and a forecast-free allocation overlay can place one trade inside a broader regime instead of treating it as a standalone bet.
- A mid-1960s shift replaced per-stock time-series fittings with one cross-sectional formula that ranked the same universe at a single date instead of forecasting each name’s next-year average price.
- Sequential ranks were then bucketed one through five from known inputs, and Rank rotation stayed a public signal by scoring on the same date, grouping in sequence, and abstaining from unpublished front-running of the top bucket.
- An Equal-weight portfolio treats every name as equally important, so mid- and smaller-capitalization strength can register even when capitalization-heavy gauges look weak.
- A later Asset allocation overlay used no component estimates or forecasts and had favored equities since the prior December before the equity sleeve was raised in mid-February 2001 to 80-90%.
One trade inside a broader picture
This archive article uses a historical ranking case to teach how an Equal-weight portfolio market picture, sequential Rank rotation buckets, and a forecast-free Asset allocation overlay can place one trade inside a broader regime instead of treating it as a standalone bet. That framing is editorial.
A mid-1960s shift moved the work from per-stock time-series fittings to one cross-sectional formula. The new formula ranked the same universe at a single date instead of forecasting each name’s next-year average price.
Rank rotation as a same-date procedure
After that change, sequential ranks were bucketed one through five, with one best, using known inputs rather than forecasts. A 1,700-stock survey placed 100, 300, 900, 300, and 100 names in those five buckets.
Cross-section inputs included 10-year relative earnings growth, prices, earnings momentum, earnings surprise, and price volatility. The procedure compared stocks with one another rather than years of over- and undervaluation.
Rank rotation here is a testable procedure: same-date scoring, sequential grouping, and abstention from unpublished front-running of the top bucket so the published ranks remain the public signal.
When an equal-weight picture diverges
Equal-weight market pictures can diverge from capitalization-heavy gauges. One arithmetic index was up 2% year to date while a broad cap-weighted series including income was down 8.7% and a large-company average was down 11.7%.
That Equal-weight portfolio construction treats every name as equally important, so mid- and smaller-capitalization strength can register even when large-company averages look weak.
Equal-weight Value Line versus cap-weighted averages, year to date
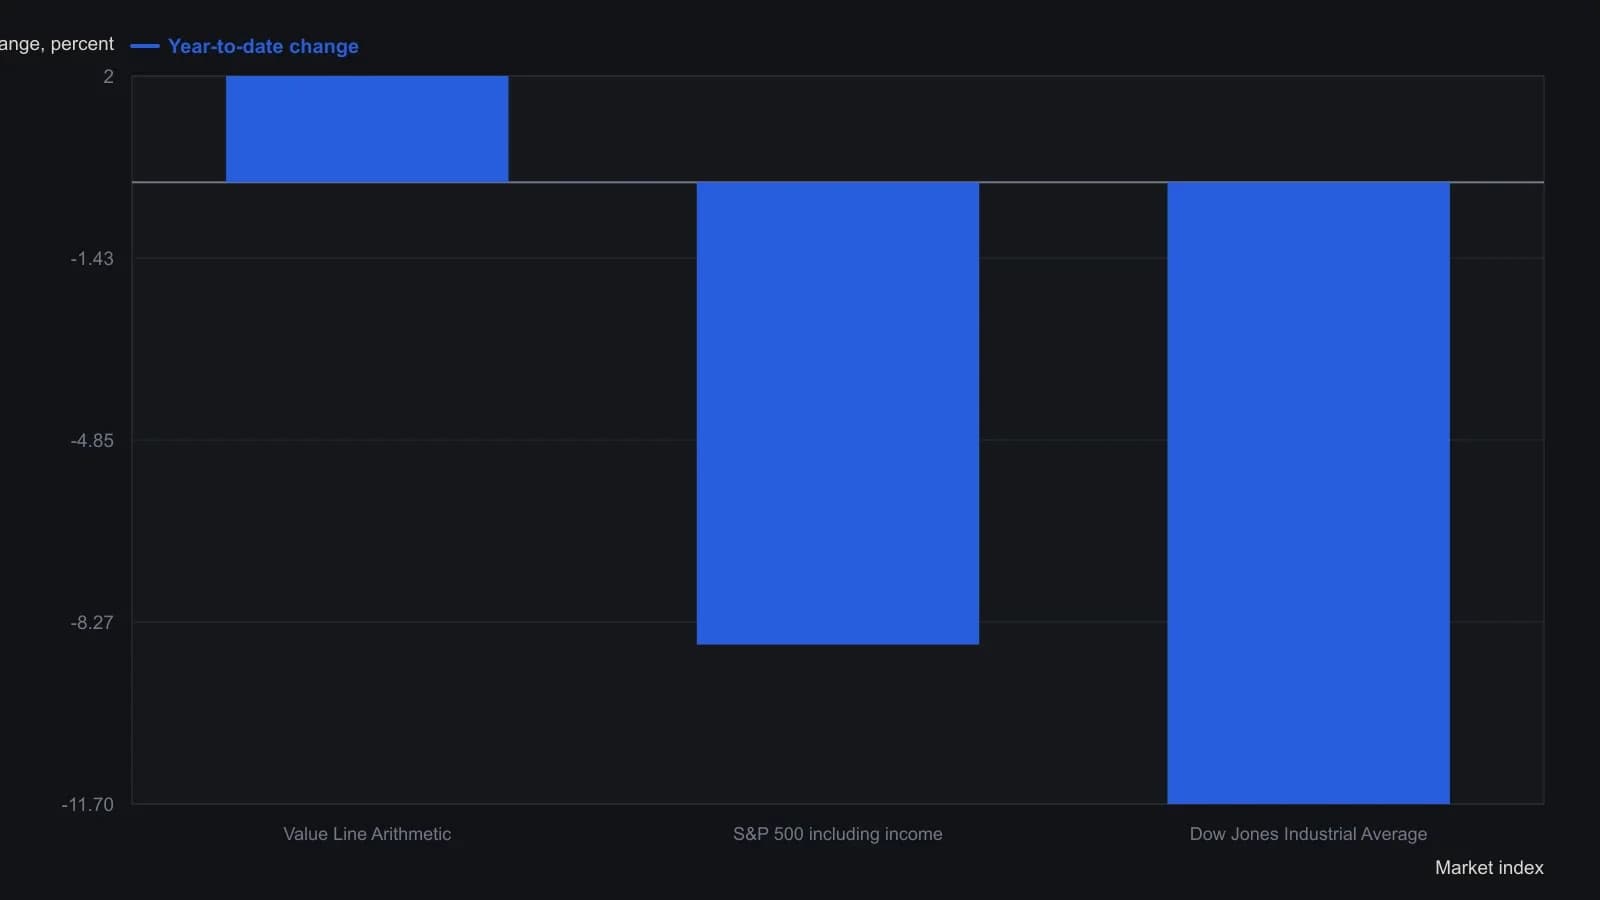
The S&P figure is total return including income, as he phrased it. The snapshot is as of the 16 October 2000 interview, not a year-end close.
A forecast-free allocation overlay
A later Asset allocation overlay used no component estimates or forecasts. It had favored equities since the prior December, and the equity sleeve was raised in mid-February 2001 to 80-90%.
Read as editorial context rather than archive instruction, the overlay sits on top of the equal-weight picture and the published ranks. Together they locate a single name inside a broader regime instead of leaving the rank as a standalone bet.
All readings on this track · 10 readings
- 1992Evaluating equity sleeves against an index-proxy cost drag
- 1996Match a technology position to an index-proxy, then to a listed futures contract
- 2001Equal-weight pictures, rank rotation, and regime-aware allocation
- 2005Listed index baskets as allocation sleeves
- 2016A 9/36 inflation state for a commodity and dollar basket
- 2016Liquidity filters, weighting rules, and index proxies in a same-category sleeve
- 2018Values-screened ETF sleeves as an allocation case study
- 2019Equal-weight rank-rotation tests for a disclosed value book
- 2019High-dividend-paying ETFs as a portfolio-construction choice
- 2020A Nasdaq-100 proxy as a construction problem, not a ticker