2019issue C096-11
High-dividend-paying ETFs as a portfolio-construction choice
A high-dividend-paying ETF is a construction and allocation decision. Compare how equal-weighting, rank-rotation, and asset-allocation change sector tilt, yield, and regime behavior before judging any single product.
- Over a long buy-and-hold window, reinvested dividends can lift a broad-market ETF's total return well above its price-only path.
- Six large high-dividend-paying ETFs were screened on composition, fees, relative results, and yield, so the review is an allocation comparison rather than a single-ticker pick.
- Equal-weighting, dividend-weighted, and capitalization-weighted rules produce different sector tilts, including a 21.8% real-estate sleeve in one equal-weighted product.
- From October 2011 through mid-June 2019, the two highest-ranked high-dividend-paying ETFs in the set still trailed a broad-market ETF on price, while that broader path showed higher volatility.
Read the income sleeve as total return
Over a long buy-and-hold window, reinvested dividends can lift a broad-market ETF's compounded result well above its price-only path. Total return is the combined result of price change and reinvested dividends over a holding period.
On a 20-year window, adding dividends raised the S&P 500's annualized result from 3.9% to 5.9%, illustrating how income compounds when capital stays invested. A high-dividend-paying ETF packages stocks screened for above-benchmark dividend yield into one tradable portfolio. As a TradersWeek editorial starting point, the first review step is how that income sleeve is built.
Compare several large products as one allocation set
A high-dividend ETF review can be framed as an allocation comparison: six large products were screened on composition, fees, relative results, and yield rather than on a single ticker. Assets under management served as a size filter for comparing liquid, established income ETFs. The expense ratio belongs in that screen because the annual fund fee reduces the investor's captured yield and total return.
At the review date the S&P 500 yielded 1.86%, while the six high-dividend ETFs yielded between 2.41% and 4.29%, so the income sleeve was a deliberate yield overlay. Yield is the income rate paid by the portfolio relative to its price, and it can fall when prices rise even if cash dividends are unchanged.
Equal-weighting changes the sector mix
Equal-weighting is an explicit construction choice in at least one high-dividend ETF, contrasting with dividend-weighted and capitalization-weighted peers in the same comparison set. Equal-weighting assigns the same portfolio weight to each holding rather than scaling by market capitalization or dividend size. Dividend-weighted scales each holding by its dividend contribution rather than by market capitalization or equal share.
Sector weights differ by construction rule: one product can concentrate in utilities while another concentrates in real estate, so the same income theme is not a uniform allocation. A 21.8% real-estate sleeve in an equal-weighted high-dividend product shows how one allocation decision can dominate a one-year result when that sector leads. That overweight is a sector tilt relative to a broad market benchmark.
Rank-rotation of the set still left a price gap
From a common start date in October 2011 through mid-June 2019, the two highest-ranked high-dividend ETFs in the set still trailed a broad-market ETF on price, while that broad-market path showed higher volatility.
As a TradersWeek editorial interpretation, that screen is rank-rotation applied to candidate sleeves. Rank-rotation ranks candidate holdings by a dividend or quality rule and then rotates the portfolio according to that ranking. The archive used the ranking as a historical workflow for comparing products. It did not show that the top-ranked high-dividend-paying ETFs led the broad market on price.
Cumulative price returns of high-dividend ETFs versus SPY
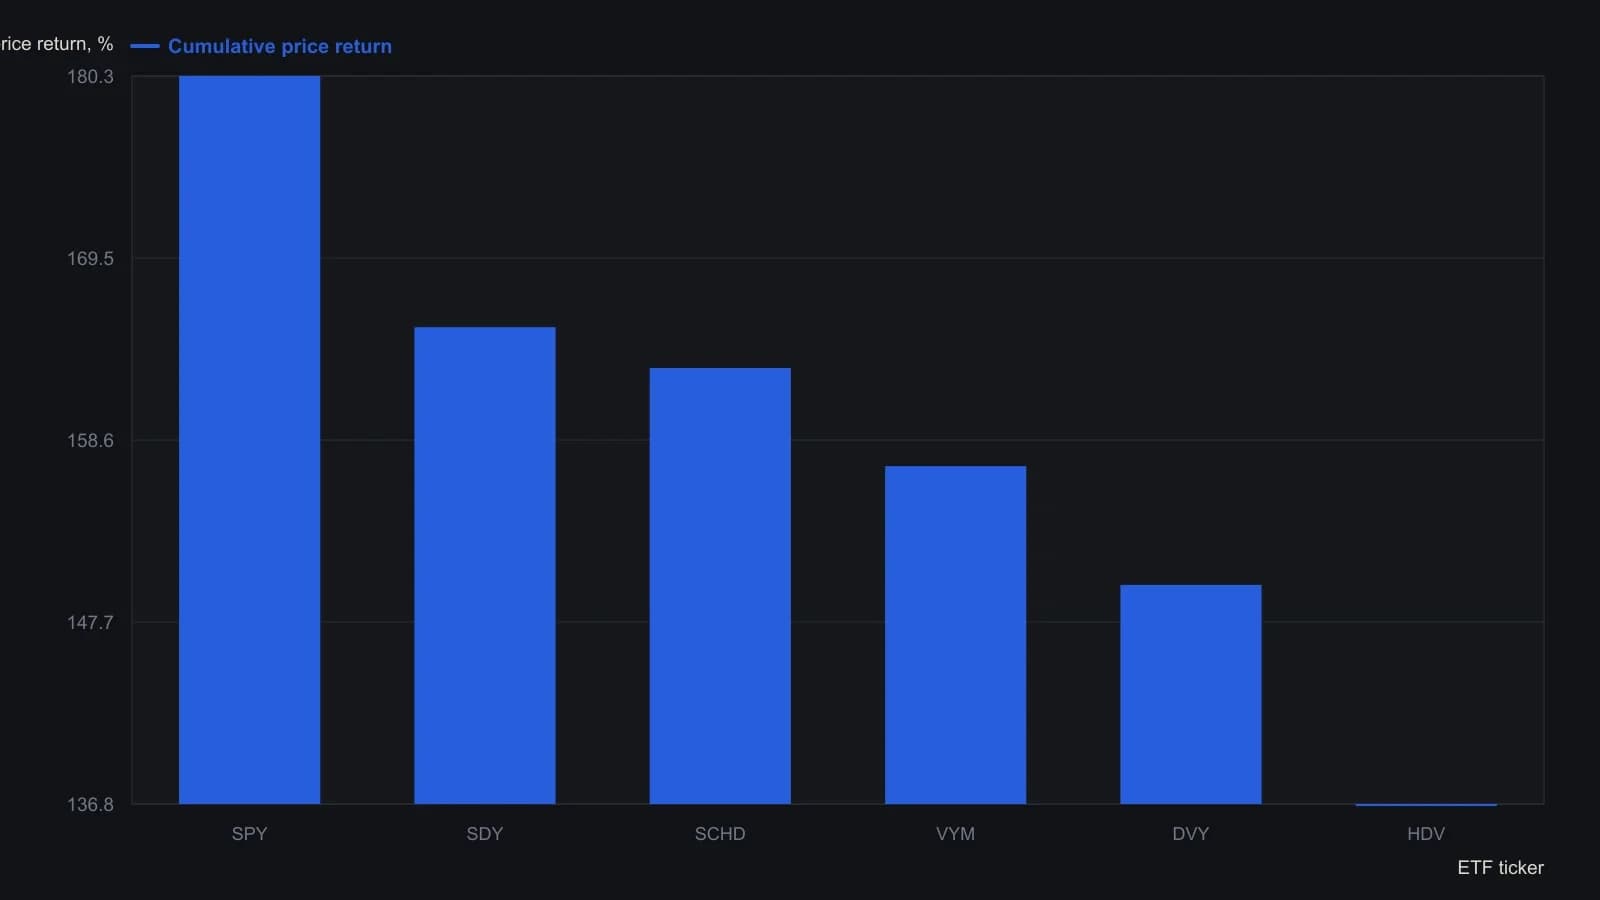
SPYD is omitted because it launched in 2015, after the common start. These are price returns, not total returns with dividends reinvested. The plotted window on the source chart is 1 November 2011–12 July 2019; the printed totals use 20 October 2011–19 June 2019.
Asset-allocation and a declining tape
In a declining tape, a heavier allocation to defensive groups such as utilities, consumer staples, real estate, and healthcare is presented as more resilient than cyclical tilts.
As a TradersWeek editorial interpretation, asset-allocation is the choice of how much weight to give sectors, styles, and complementary vehicles so one income sleeve sits in a diversified or regime-aware book. Equal-weighting, rank-rotation, and the defensive-versus-cyclical mix are separate construction decisions. The editorial reading is that those decisions are the object of the evaluation, not a single income label.
All readings on this track · 10 readings
- 1992Evaluating equity sleeves against an index-proxy cost drag
- 1996Match a technology position to an index-proxy, then to a listed futures contract
- 2001Equal-weight pictures, rank rotation, and regime-aware allocation
- 2005Listed index baskets as allocation sleeves
- 2016A 9/36 inflation state for a commodity and dollar basket
- 2016Liquidity filters, weighting rules, and index proxies in a same-category sleeve
- 2018Values-screened ETF sleeves as an allocation case study
- 2019Equal-weight rank-rotation tests for a disclosed value book
- 2019High-dividend-paying ETFs as a portfolio-construction choice
- 2020A Nasdaq-100 proxy as a construction problem, not a ticker