2001issue C151-2
Building custom stock baskets with weights and averaging
A 2001 retail brokerage treated a stock basket as many names in one account that the holder could still edit. After a ready-made basket was shortlisted and inspected, the mix could be restated in dollars or shares, and scheduled dollar-cost averaging could sit on the same ticket as rebalancing and name-level trades.
- A stock basket kept many names in one account while each constituent stayed visible and editable.
- Ready-made baskets were grouped by market, style, risk, sector, theme, and geography, then shortlisted from a style and risk questionnaire and inspected before any purchase.
- Names could be added or deleted and the mix restated in dollars or shares, so equal-weight construction and an asset-allocation edit remained holding-level rules.
- Advanced tickets combined rebalancing, name-level trades, scheduled dollar-cost averaging, and basket-for-basket exchanges, with windowed execution as the routine path.
A stock basket as a hybrid holding
A 2001 retail brokerage presented a stock basket as a hybrid holding: many names in one account, with the holder still choosing which securities stayed in the list. The stock basket was a named list of individual equities held together so each constituent remained visible and editable.
Ready-made baskets and a shortlist
About ninety ready-made baskets were grouped by major market, investment style, risk, sector, social theme, special lists, geography, analyst selections, bonds, and media favorites. A ready-made basket was a prebuilt list that could be inspected before any order was sent.
A questionnaire mapped stated style and risk tolerance to a shortlist of those ready-made baskets, which could then be inspected with on-site analytics before any purchase.
Holding-level weight rules
After a basket was chosen, names could be added or deleted and the mix restated in dollars or in shares. An asset-allocation edit rewrote how much of the basket sat in each name, entered in currency or in share counts. Equal-weight construction assigned the same starting share of capital to each name still in the basket. Asset-allocation and equal-weight rules were therefore editable at the security level rather than locked inside a pooled product.
Review measures and a basket-backtest
The review pane showed sector weights plus price-to-earnings, price-to-sales, price-to-book, capitalization, volatility, and beta against five available indexes.
A basket-backtest compared a candidate basket with a benchmark before the list was funded. The comparison set was limited to a few large-cap and broad-market averages and was described as uninformative for some styles, including bonds.
Tickets, averaging, lots, and windows
Advanced tickets combined rebalancing, name-level buys and sells, scheduled dollar-cost averaging, and basket-for-basket exchanges. Dollar-cost averaging added a fixed cash amount on a calendar, independent of the latest print. The tickets also displayed estimated short- and long-term gains from the lots to be sold.
Sales could follow an explicit tax-lot rule, including first-in first-out, last-in first-out, and several choices that minimized or maximized gain or holding-period gain.
Routine orders were limited to 2500 listed names and were intended to fill in two daily windows. Windowed execution waited for those matching sessions instead of going to the continuous market. A separate higher-commission path was available if an order had to go straight to the continuous market.
FOLIOfn International folio versus S&P 500, 3-month backtest
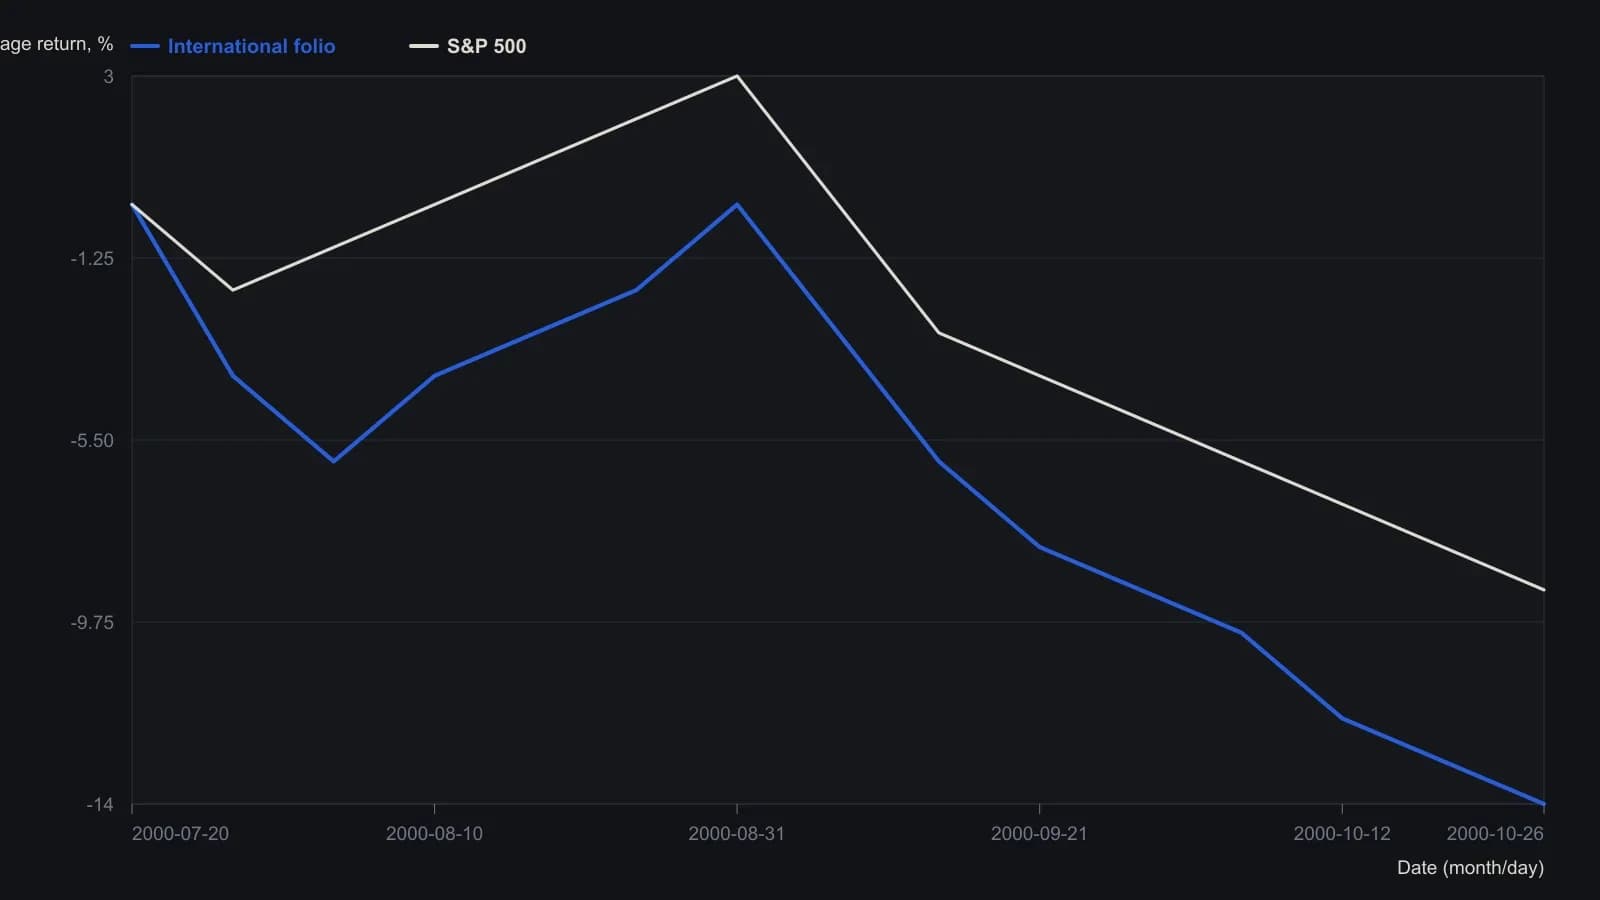
The site assumed a $25,000 starting investment and used a dotted line when at least one name in the folio did not yet exist. Dates and percent returns are approximate readings from the raster, not published ticks.
All readings on this track · 11 readings
- 1989Testing dollar-cost and scale-in averaging as position-sizing procedures
- 1994Quality screens and dividend-yield regime maps
- 1998Cash recovery grids for residual share construction
- 2001Building custom stock baskets with weights and averaging
- 2012Evaluating dollar-cost averaging as an entry-slot procedure
- 2013Treat a short-term valuation oscillator as an entry-timing filter
- 2014Equal-dollar staging versus lump-sum and residual scaling
- 2015A fund pick is unfinished until cost-drag and the mix are tested
- 2016Broad index allocation, a cash reserve, and staged entries
- 2017Call-ratio overlay versus averaging down on a losing stock
- 2019Overfunding smaller index futures to set leverage