2018issue C0160-64
Values-screened ETF sleeves as an allocation case study
A socially screened ETF is easier to judge as one weeks-to-months allocation sleeve than as a standalone idea. Map the fundamental overlay first, check equal-weighting against concentration, then read liquidity, cost, and weights as market-regime context beside other holdings.
- Socially-responsible-investing began with common exclusions such as tobacco, firearms, and alcohol, then widened into ESG rules that act as a fundamental overlay on which names can enter the book.
- Listed socially responsible ETFs were still a small slice of a much larger screened-asset pool, with assets and inflows concentrated in a few large products from three sponsors.
- A shared overlay did not produce interchangeable sleeves: smaller funds followed different benchmarks, including a small- and mid-cap impact equal-weight design, and many names had thin volume and higher costs.
- Editorial sequence: map the overlay, check equal-weighting versus concentration, then use liquidity, cost, and weights as market-regime context beside other holdings rather than ranking products as one construction.
Older exclusions became a fundamental overlay
Socially screened portfolios in the 1960s commonly excluded tobacco, firearms, and alcohol. The category later widened into environmental, social, and governance rules covering climate, carbon, and related issues.
In this construction, that widening is a fundamental overlay: values, exclusion, or ESG rules are layered onto security selection so the sleeve no longer matches an unscreened market-cap book. Socially-responsible-investing here means including or excluding companies according to stated social, moral, or sustainability rules.
Listed products were a small slice
As of 16 October 2017, a listed set of 51 socially responsible ETFs had about $5.24 billion in combined market value after the count had doubled in two years. ESG-related mutual funds were estimated near $2 trillion, so the listed ETFs were still a small slice of the wider screened-asset pool.
Largest ESG ETFs by market cap, 16 October 2017
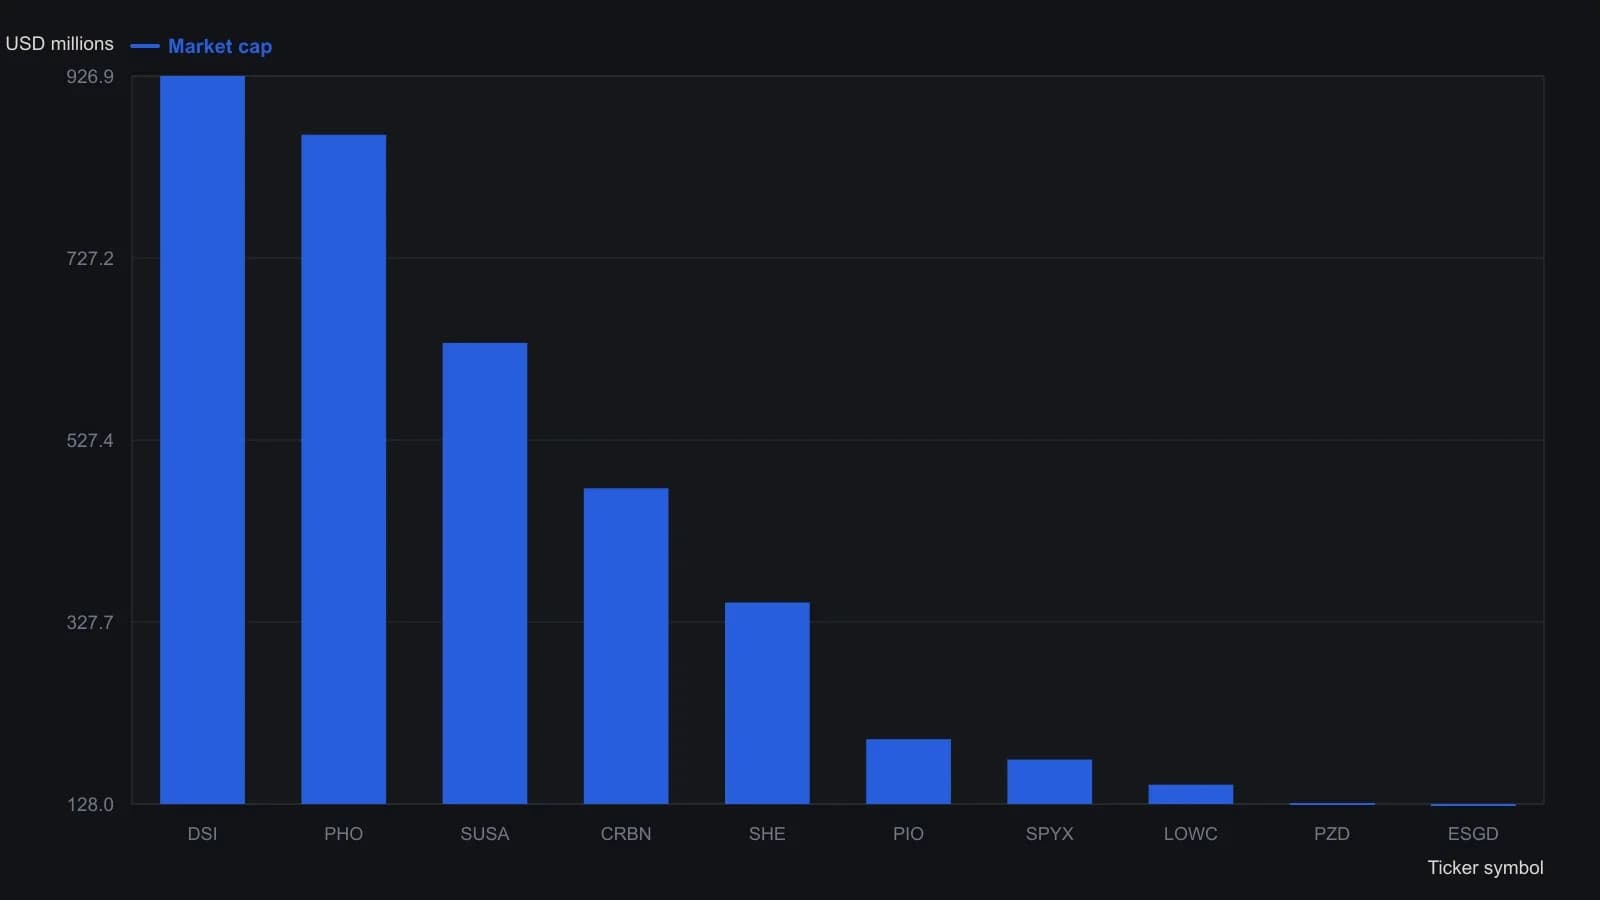
xtf.com snapshot as of 16 October 2017. The article states these ten funds accounted for 77% of ESG ETF assets.
Flows, sponsors, and trading volume
Aggregate one-month flows into those 51 ETFs were $137.8 million versus a $2.6 million average, indicating a recent inflow surge into the sleeve. The ten largest products came from three established sponsors, accounted for 77% of category assets, and mostly traded under 50,000 shares a day. That liquidity profile was described as poorly suited to active trading because of wider spreads.
Three large sponsors held $4.02 billion of the $5.24 billion total, leaving 41 other ETFs with lower assets, thinner volume, and weaker inflows that could limit scale.
Equal-weighting was not a shared design
Ten smaller ETFs with $20 to $36 million in assets totaled $431.5 million, carried expense ratios from 0.40% to 0.70%, and typically traded under 6,000 shares a day. Those smaller funds followed different benchmarks, including a small- and mid-cap impact equal-weight design, so a shared fundamental overlay did not produce interchangeable allocations.
Equal-weighting assigns constituents similar weights instead of letting the largest names dominate the sleeve. Editorial reading: concentration versus equal-weighting has to be checked fund by fund before the sleeve is placed beside other holdings.
Place the sleeve beside the rest of the book
Comparing screened ETFs requires matching each fund’s objective, overlay rules, top holdings, costs, and own benchmark rather than ranking the products as if they shared one construction.
Editorial reading of that workflow: asset allocation is how the screened ETF sleeve sits beside other markets, volatilities, carry, and portfolio weights over weeks to months. Market regime is the cross-market setting of prices, volatility, carry, and weights in which that single sleeve is judged.
All readings on this track · 10 readings
- 1992Evaluating equity sleeves against an index-proxy cost drag
- 1996Match a technology position to an index-proxy, then to a listed futures contract
- 2001Equal-weight pictures, rank rotation, and regime-aware allocation
- 2005Listed index baskets as allocation sleeves
- 2016A 9/36 inflation state for a commodity and dollar basket
- 2016Liquidity filters, weighting rules, and index proxies in a same-category sleeve
- 2018Values-screened ETF sleeves as an allocation case study
- 2019Equal-weight rank-rotation tests for a disclosed value book
- 2019High-dividend-paying ETFs as a portfolio-construction choice
- 2020A Nasdaq-100 proxy as a construction problem, not a ticker