1999issue C071-6
Constructing isolated synthetic waveforms to watch indicator settling
A historical construction workflow builds handmade triangular and rectangular price segments, then a time-and-amplitude-symmetric double-triangle wave, so Williams %R, a moving average, and exponential smoothing can be watched between designed turns. Extra lead-in bars cover long lookbacks, and later packed turns show interference when isolation is incomplete.
- About 50 price bars before and after each high or low, totaling 550 days on a time-and-amplitude-symmetric double-triangle wave, is presented as usually enough for default indicator settings to settle between turns.
- A few hundred extra bars at the start of the synthetic file are described as necessary so a 200-day moving average still has coverage before the first designed turn.
- On the same double-triangle path, a simple moving-average family produces more loosely compacted post-turn crossovers than the exponential-average family used in a multiple-average layout.
- When the close is reprogrammed to fall to the lows beginning the day before a peak, shortening Williams %R from a 26-day span to a 15-day span is shown driving the oscillator below the overbought line a day before that peak.
Build handmade price segments
Handmade triangular or rectangular segments can be built in a spreadsheet by placing constants or simple increment equations in an initial row and copying them across contiguous vectors. The archive illustrates that copy step as four vectors of 100 cells.
Open, high, low, and close on the synthetic series are constructed from an open column first. Offset formulas then add one unit for the high, subtract one unit for the low, and set the close from the high column.
First programmed upturn of the handmade triangle close
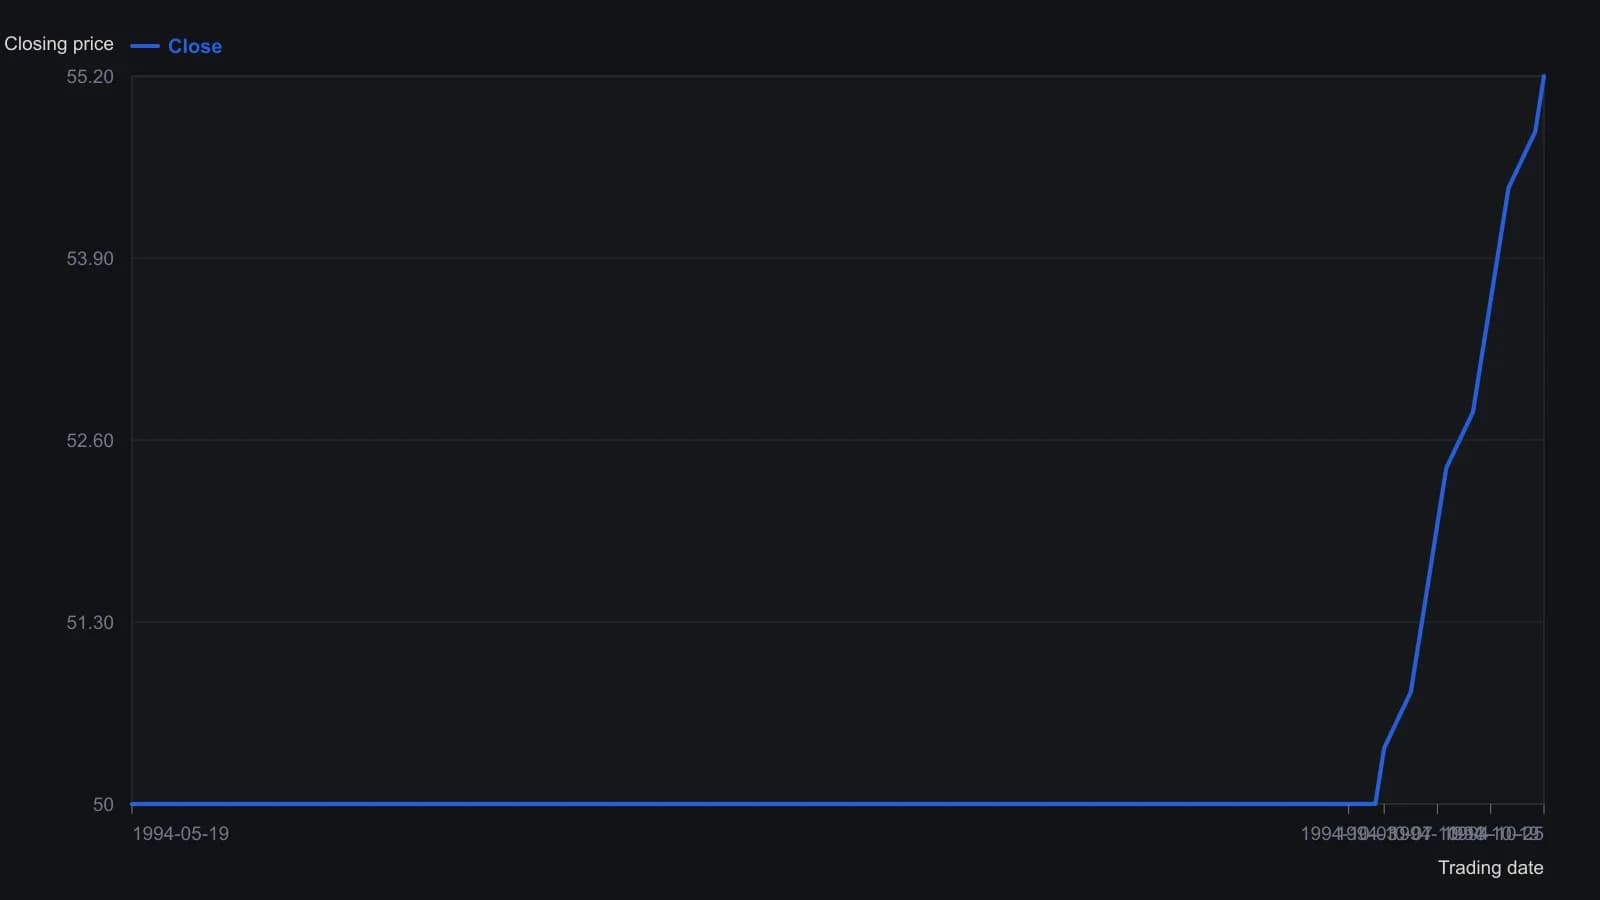
Open is held at 49 through row 99, then Open[t]=Open[t-1]+0.4. High equals Open+1, Low equals Open-1, and Close is set equal to High. Rows between 21 May and 28 September are not on the printed sheet, so they are omitted rather than filled in.
Leave room for default settings to settle
A construction rule of about 50 price bars before and after each high or low, totaling 550 days on a time-and-amplitude-symmetric double-triangle wave, is presented as usually enough for default indicator settings to settle between turns.
Adding a few hundred extra bars at the start of the synthetic file is described as necessary so long-lookback constructions such as a 200-day moving average still have coverage before the first designed turn.
Watch averages on the double-triangle path
On the same double-triangle path, a simple moving-average family produces more loosely compacted post-turn crossovers than the exponential-average family used in a multiple-average layout.
Longer exponential averages on that path keep separating while the trend persists and become parallel only if the trend lasts long enough, a state already reached by the shorter averages in the illustrated case.
Editorial: treat that contrast as a construction lesson in Moving average versus Exponential smoothing on a designed path, not as a statement about live markets.
Reprogram the close and shorten Williams %R
When the close is reprogrammed to fall to the lows beginning the day before a peak, shortening Williams %R from a 26-day span to a 15-day span is shown driving the oscillator below the overbought line a day before that peak.
Pack later turns to show interference
The construction method also includes later waveforms that pack successive turns closer together so interference from incomplete isolation can be observed.
Editorial: the packed waves are the contrast case for the isolated double-triangle, so incomplete settling can be watched on purpose.
All readings on this track · 13 readings
- 1987Constructing a volume-confirmed Williams %R
- 1991Audit inverse-range oscillators before stacking stochastic %K and Williams %R
- 1991Signed midpoint range oscillator from stochastic and Williams
- 1993Confirm an intradate candlestick only after a longer cycle reprints it
- 1994Building average directional index, the stochastic pair, and Williams percent R from highs, lows, and closes
- 1994Label the tape before you read stochastic or Williams %R
- 1996Calibrating Williams %R entries in rising channels
- 1997Dynamic zones for oscillator buy and sell levels
- 1998Regression channels anchored to Williams %R turning windows
- 1999Constructing isolated synthetic waveforms to watch indicator settling
- 2000Choosing a scale for moving-average oscillators
- 2004Splitting entry and exit speed by regime
- 2008Count the run, then confirm the pivot at a channel edge