1994issue C041-10
Label the tape before you read stochastic or Williams %R
A rising, flat, or falling average directional index was used to name the regime first. Only then was a stochastic oscillator or Williams %R print read as a range reversal, a trend-permission cross, or an exhaustion warning.
- Regime-dependence means the stochastic oscillator and Williams %R are read only after the tape has been labeled flat, ranging, trending, or accelerating.
- A rising average directional index named a trend; a flat or falling path named sideways or range conditions, with four bands from flat through hypertrend.
- In flat and falling-average-directional-index range segments, Williams %R extremes and %K reversals without a %D cross were the timing cues.
- In trending segments the preferred cue was a %K cross of %D, while hypertrend divergences were treated as early warnings that the directional phase was ending.
Oscillator-style tools such as the stochastic oscillator were applied mainly in sideways markets to locate turning points between support and resistance. That use came after a first decision: whether the market was trending or ranging. The same %K print, or the same Williams %R extreme, is not a single forecast. It is a reading that changes once the tape has been labeled flat, ranging, trending, or accelerating. That change of reading is regime-dependence.
Why visual regime labels were not enough
Chart geometry can show an uptrend as higher highs and higher lows, a downtrend as the reverse, and a trading range as sideways travel. Visual inspection was treated as hard to convert into formal four-way regime rules. Average directional index supplied the label instead. A rising average directional index was used as a trending-market label. A flat or falling average directional index was used as a sideways or range label. Average directional index is a trend-presence measure whose rising, flat, or falling path is used to separate sideways tape from directional tape.
Four average directional index bands
Four average directional index bands were used to name regimes. Declining readings below 10 to 15 were treated as flat. Readings from 16 to 25 were treated as a trading range. Readings from 26 to 40 were treated as a trend. Sharply rising readings above 41 were treated as a hypertrend. A hypertrend is a directional regime marked by a sharply rising average directional index above a high threshold, and it could be up or down.
Four ADX bands that name the tape
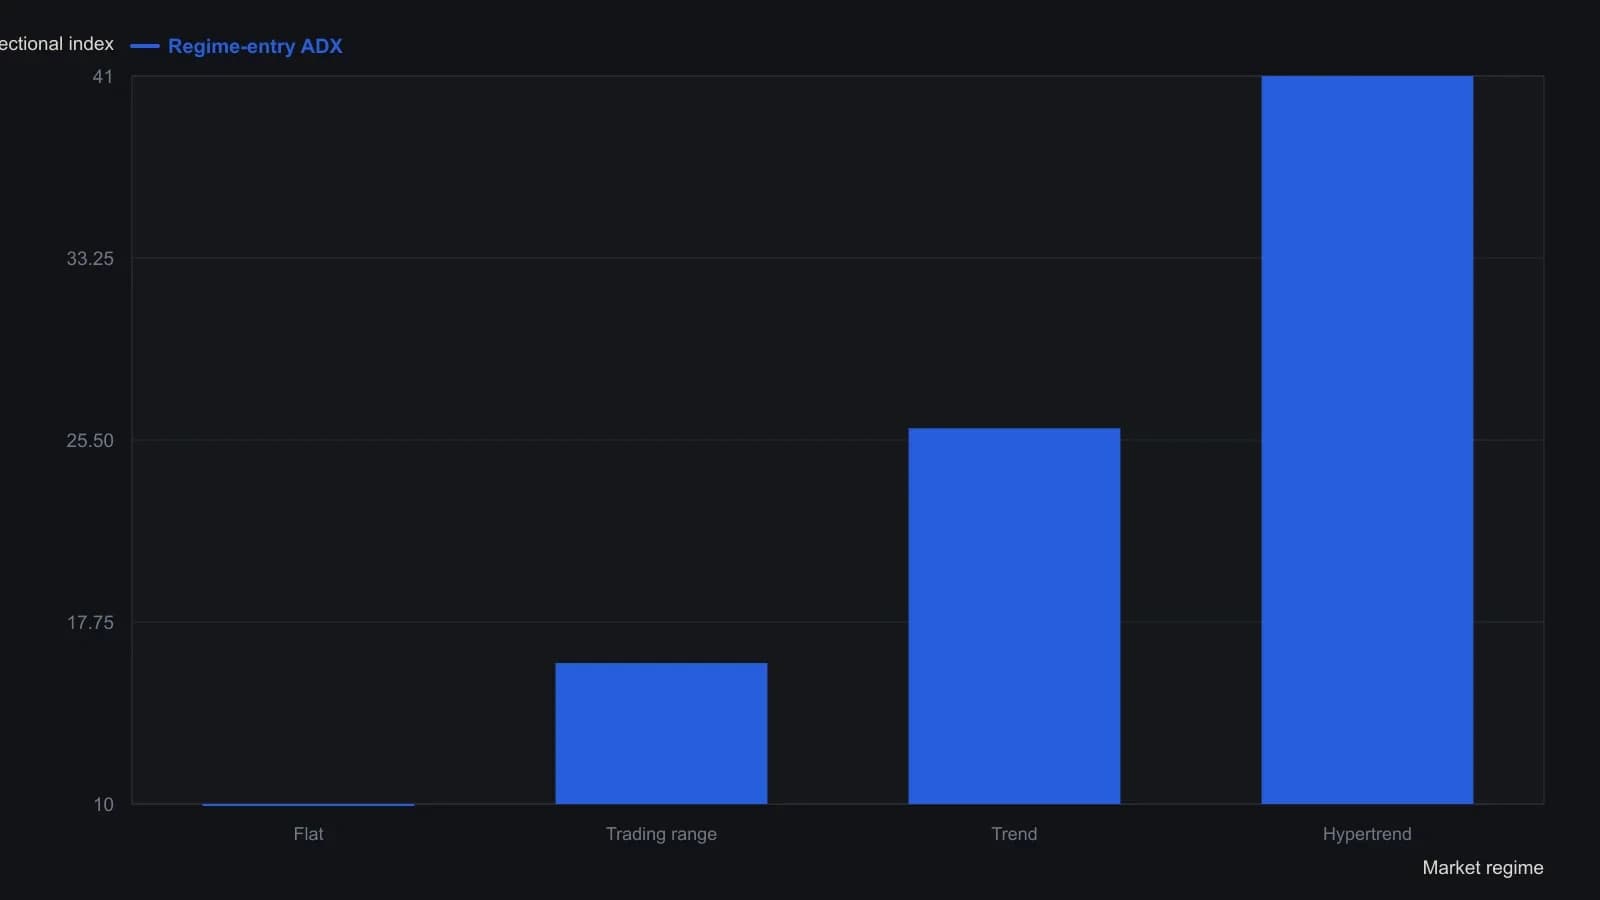
Flat is a declining ADX below the 10–15 zone; the bar uses the 10 floor named first. Hypertrend has no stated ceiling; the later T-bond example cites a reading over 50. Worked examples used a 12-bar stochastic and Williams %R.
Two oscillators, one price-location idea
Williams %R and the stochastic oscillator share the same price-location construction. The stochastic oscillator is a bounded oscillator from ordered prices over a lookback, read through %K turns and its relation to a slower %D line. Williams %R is an unsmoothed oscillator on that same price-location idea, so extremes arrive at the floor and ceiling sooner. That faster arrival was used as a timing cue in flat markets.
Flat tape and Williams %R extremes
In a documented flat interval with average directional index at or below 15, Williams %R approaching its floor of -100 was treated as the long timing extreme, and approaching its ceiling of 0 as the short timing extreme.
Falling average directional index ranges
In falling average directional index range segments, stochastic timing was taken when %K reversed without waiting for a %D cross. Those reversals were treated as stronger when %K was above 20 or below 80.
Trending tape and the %K and %D cross
In trending segments, stochastic timing was taken on %K crossing %D, with preferred crosses above 80 or below 20. Confirmation was taken from Williams %R divergence, plus turns in a moving-average oscillator or moving-average momentum. Divergence means price making a new extreme while an oscillator fails to confirm that extreme.
Hypertrend and early ending warnings
In a hypertrend example with average directional index above 50, divergences in the stochastic oscillator and Williams %R were treated as early warnings that the directional phase was ending.
An editorial reading habit
This paragraph is editorial, not an archive claim. Keep the order fixed: name the regime with average directional index, then read the stochastic oscillator or Williams %R. The archive workflow above is how those prints were conditioned. The editorial habit is to let one series change meaning with the label, rather than forcing a single oscillator rule onto every tape.
All readings on this track · 13 readings
- 1987Constructing a volume-confirmed Williams %R
- 1991Audit inverse-range oscillators before stacking stochastic %K and Williams %R
- 1991Signed midpoint range oscillator from stochastic and Williams
- 1993Confirm an intradate candlestick only after a longer cycle reprints it
- 1994Building average directional index, the stochastic pair, and Williams percent R from highs, lows, and closes
- 1994Label the tape before you read stochastic or Williams %R
- 1996Calibrating Williams %R entries in rising channels
- 1997Dynamic zones for oscillator buy and sell levels
- 1998Regression channels anchored to Williams %R turning windows
- 1999Constructing isolated synthetic waveforms to watch indicator settling
- 2000Choosing a scale for moving-average oscillators
- 2004Splitting entry and exit speed by regime
- 2008Count the run, then confirm the pivot at a channel edge