2000issue C101-6
Choosing a scale for moving-average oscillators
A 4-period versus 8-period moving-average oscillator is unnormalized and reads in price units, so its range changes with the instrument. Four constructions rescale that spread: divide by average price, divide by the standard deviation of price, divide by average true range, or map the oscillator onto its own historical range.
- A 4-period versus 8-period moving-average oscillator is unnormalized and stays in price units, so its numeric range changes with the instrument instead of remaining inside a fixed 0 to 100 interval.
- Four specified rescales are divide by average price, divide by the standard deviation of price, divide by average true range of price, or map the oscillator onto its own historical range.
- A Williams %R map of the raw 4/8 oscillator is the only examined form that hard-caps output at 0 and 100, regardless of instrument, timeframe, or input scale.
- After these scalings, values are described as more consistent for long-history, cross-instrument, and multi-timeframe comparison, and less dominated by sudden volatility changes.
Unnormalized readings stay in price
A moving average here is a lookback mean of ordered closes. A short mean minus a long mean produces an oscillator. When that oscillator is left as a 4-period versus 8-period spread, it is an unnormalized oscillator: the reading is still a price increment. Its numeric range therefore tracks the instrument, the average price level, and recent volatility. A 0 to 100 indicator does not do that. It stays inside that interval on every series.
Crossings under fixed thresholds
Under fixed theoretical thresholds, both the 4/8 moving-average oscillator and a 5-period 0 to 100 oscillator produced crossings on daily lean-hog futures. On soybean oil the same oscillator thresholds produced no crossings, while the 0 to 100 rules still produced a comparable number.
Daily lean hog 4/8 oscillator against the ±50 fences
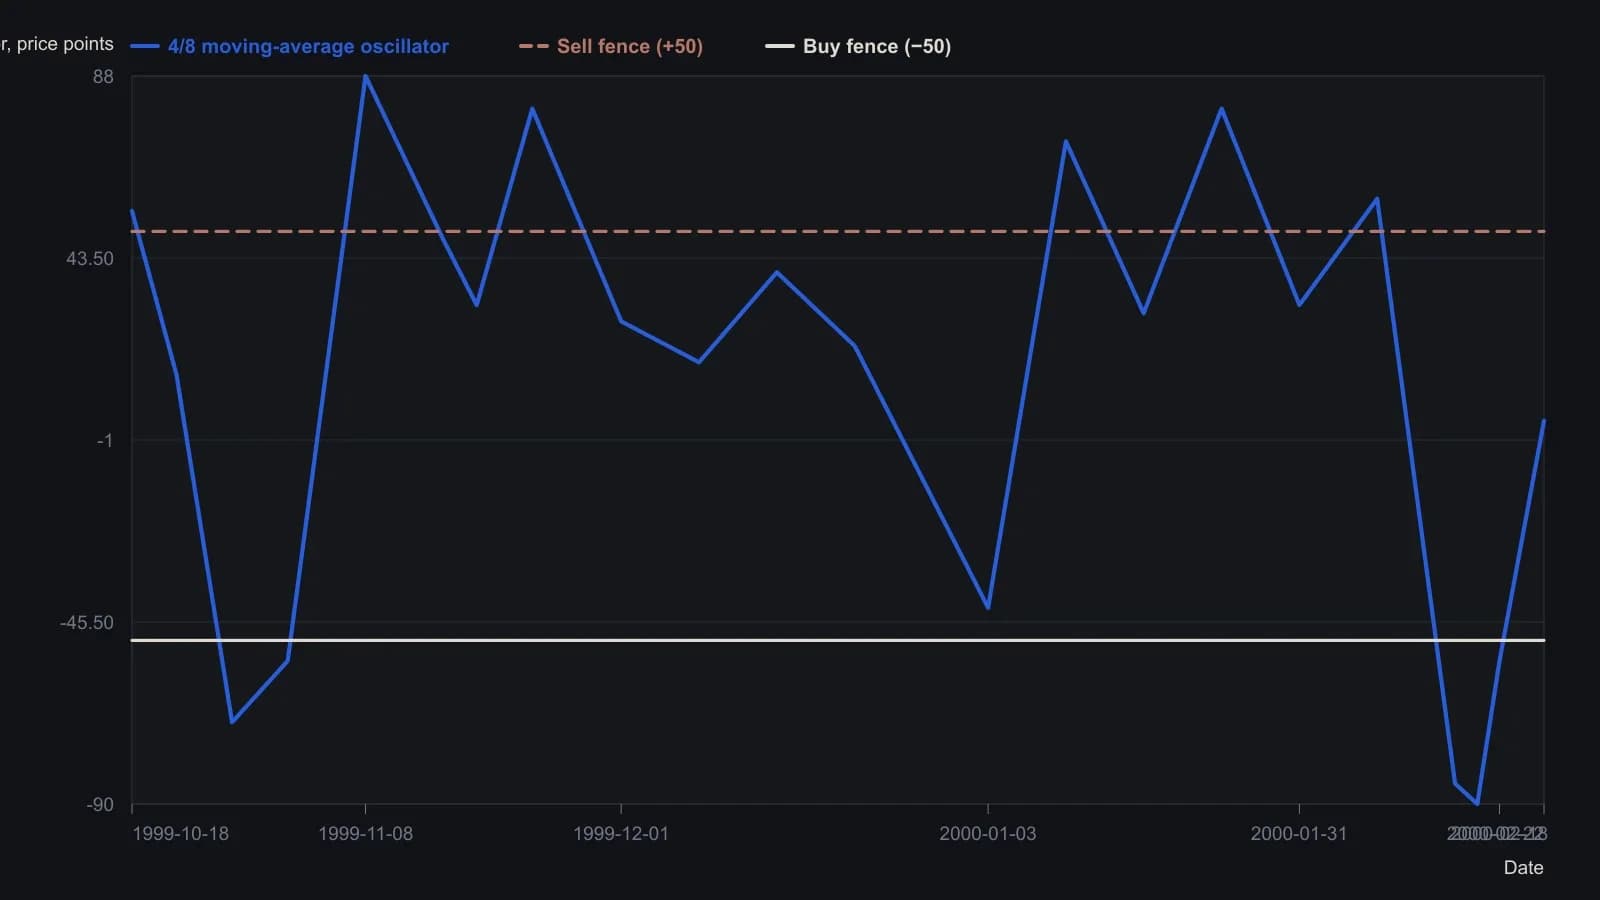
Oscillator is a 4-period minus 8-period moving average in the same price points as the lean hog quote. Sell when it crosses below +50; buy when it crosses above −50. Amplitudes are approximate except the final +3.7 readout.
Four ways to rescale the spread
Four construction choices are specified for rescaling the 4/8 oscillator. Divide it by average price. Divide it by the standard deviation of price. Divide it by average true range of price. Or map the oscillator onto its own historical range.
Average price as a level scale
Average-price construction divides the 4/8 oscillator by an 8-period moving average of closes. The same lookback mean that helps form the spread is reused as a price-level denominator. The output is a fraction of the prevailing price level rather than a raw price increment.
A z-score of closes
Z-score construction divides the 4/8 oscillator by an 8-period population standard deviation of closes. The reading is then in volatility units rather than price increments. With those parameters the scaled values stayed near plus or minus 1 on daily gold futures and on five-minute cocoa futures.
Average true range when closes understate movement
True range equals prior close minus current low when the prior close is above the current high, current high minus prior close when the prior close is below the current low, and high minus low otherwise. Average true range is a moving average of that series. It is used as an alternative volatility denominator when close-to-close dispersion understates intra-bar movement.
In cotton futures from late May through mid-June 1999, eight-period average true range more than doubled relative to eight-period close-to-close standard deviation. Dividing the oscillator by average true range damped that window more than dividing it by standard deviation.
A Williams %R map of the oscillator
Williams %R construction sets the output to 100 times (value minus lookback minimum) divided by (lookback maximum minus lookback minimum). The reading is limited to 0 to 100 regardless of instrument, timeframe, or input scale. The same map can be applied to price or to an already computed oscillator.
Applying that range map to the raw 4/8 oscillator with a 200-bar lookback produced a weekly S&P 500 series whose numeric range stayed more consistent across changing price and volatility levels. It was the only examined form that hard-caps output at 0 and 100.
What the scalings are for
After these scalings, indicator values are described as more consistent for long-history comparison, cross-instrument comparison, and multi-timeframe comparison. They are also described as less dominated by sudden volatility changes.
All readings on this track · 13 readings
- 1987Constructing a volume-confirmed Williams %R
- 1991Audit inverse-range oscillators before stacking stochastic %K and Williams %R
- 1991Signed midpoint range oscillator from stochastic and Williams
- 1993Confirm an intradate candlestick only after a longer cycle reprints it
- 1994Building average directional index, the stochastic pair, and Williams percent R from highs, lows, and closes
- 1994Label the tape before you read stochastic or Williams %R
- 1996Calibrating Williams %R entries in rising channels
- 1997Dynamic zones for oscillator buy and sell levels
- 1998Regression channels anchored to Williams %R turning windows
- 1999Constructing isolated synthetic waveforms to watch indicator settling
- 2000Choosing a scale for moving-average oscillators
- 2004Splitting entry and exit speed by regime
- 2008Count the run, then confirm the pivot at a channel edge