2008issue C111-4
Count the run, then confirm the pivot at a channel edge
A short-term trend can be treated as a countable run of new highs or new lows. The archive ends that run when the prior extreme is penetrated, then starts a pivot-signal rule only when price is already at a channel boundary and Williams %R agrees.
- A run is counted from successive higher highs or lower lows, and inside bars are skipped because they do not update the market's current limits of perceived value.
- A pivot-point is the reversal bar that ends that run after the prior extreme is penetrated, with confirmation delayed when an outside bar prints both extremes.
- Bollinger Bands mark where a run may terminate, stall, or project the next swing, while Williams %R is used as a reversal predictor only when price is already at a channel extreme.
- Editorial reading: the first reversal bar becomes a trade hypothesis only when the ended run, the channel edge, and the oscillator coincide.
How a run is counted
A short-term trend is treated as a run of successive higher highs or lower lows. Inside bars are skipped, because they do not update the market's current limits of perceived value.
The count moves only when a bar extends the existing extreme. That keeps the run tied to the market's current accepted limits rather than to every pause inside the range.
When the run ends
An up-run ends when price trades below the low of the highest-high bar. A down-run ends when price trades above the high of the lowest-low bar.
The pivot-point is that reversal bar. It ends the run of successive higher highs or lower lows after the prior extreme is penetrated.
Entering near the pivot bar is presented in the archive as keeping a failed trade inside roughly that bar's range, then holding while a new run of highs or lows continues.
Daily GE run lengths after each pivot
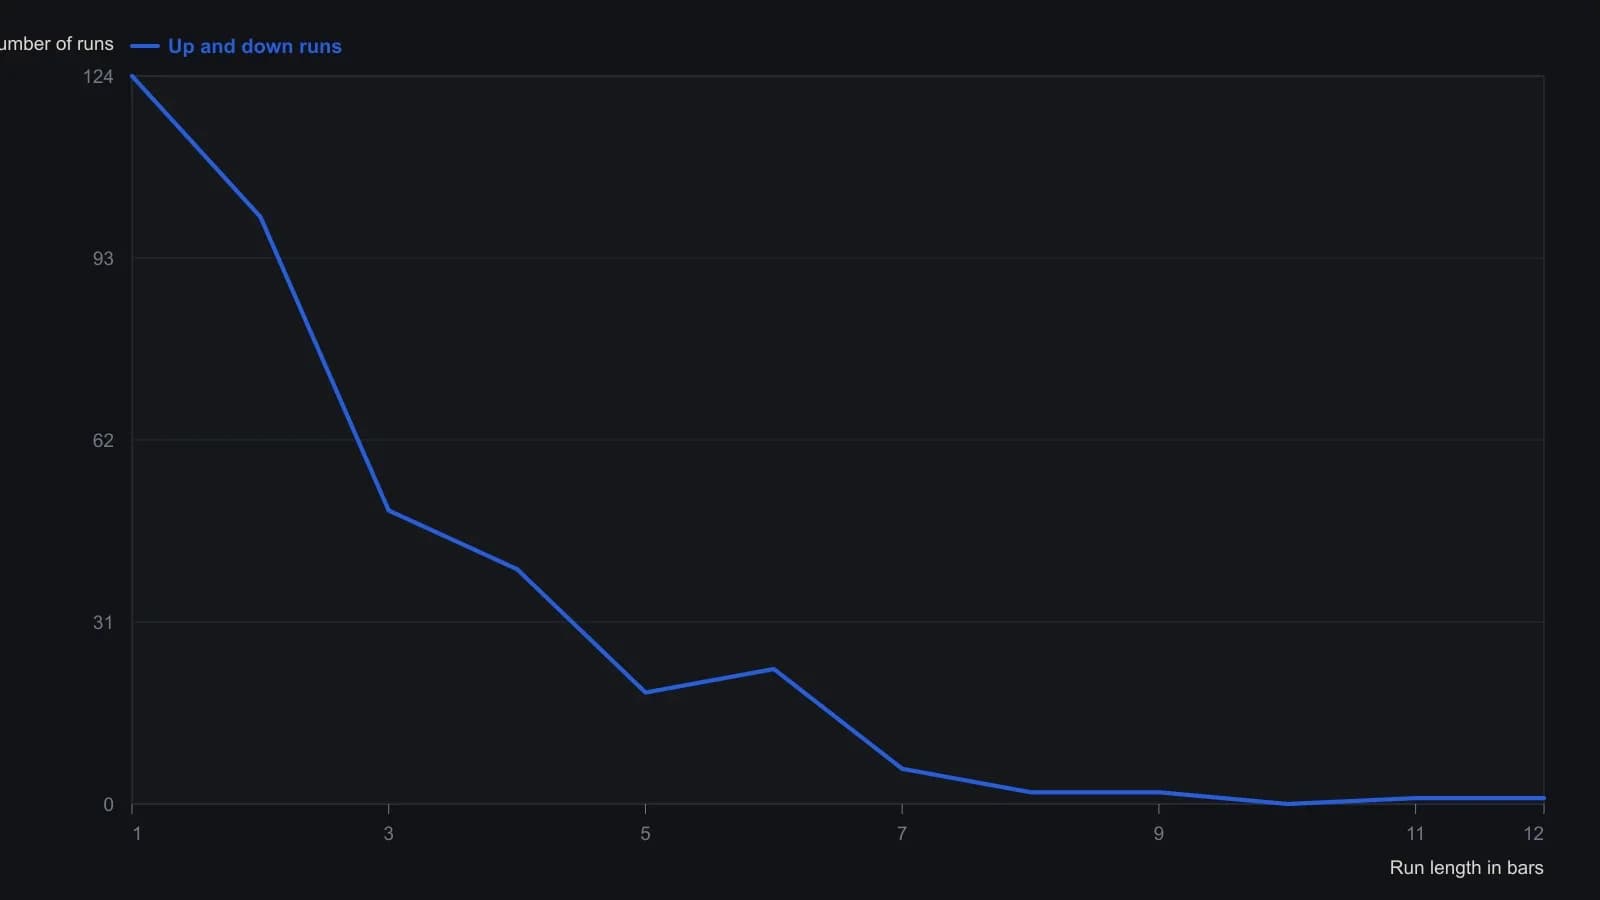
White skipped inside bars when measuring a run. One-bar runs were classed as losing trades and longer runs as profitable. Up and down runs are pooled in this distribution.
Channel location for a possible end
Bollinger Bands are used here as a price channel whose outer lines and midline locate where a run may terminate, stall, or project the next swing.
Outer lines mark candidate termination zones for the current run. Midlines are used to project the next price level and often contain corrections inside a longer-term trend.
Oscillator coincidence
Williams %R is an oscillator whose input settings can flag a likely pivot when price is already at a channel extreme. Inputs are chosen for the market.
The archive uses it as a reversal predictor and combines it with price location at a channel boundary to start a pivot-signal rule.
The combined confirmation chain
The archive describes three historical steps: count the run, end it when the prior extreme is penetrated, and start a pivot-signal rule when Williams %R agrees at a Bollinger Bands boundary.
Editorial interpretation: those steps are one confirmation chain. The first reversal bar is treated as a tradeable pivot-point only after the run has ended under the penetration rule, price sits at a channel edge, and the oscillator supports a reversal. That framing is editorial. It is not a claim the archive made about current markets.
All readings on this track · 13 readings
- 1987Constructing a volume-confirmed Williams %R
- 1991Audit inverse-range oscillators before stacking stochastic %K and Williams %R
- 1991Signed midpoint range oscillator from stochastic and Williams
- 1993Confirm an intradate candlestick only after a longer cycle reprints it
- 1994Building average directional index, the stochastic pair, and Williams percent R from highs, lows, and closes
- 1994Label the tape before you read stochastic or Williams %R
- 1996Calibrating Williams %R entries in rising channels
- 1997Dynamic zones for oscillator buy and sell levels
- 1998Regression channels anchored to Williams %R turning windows
- 1999Constructing isolated synthetic waveforms to watch indicator settling
- 2000Choosing a scale for moving-average oscillators
- 2004Splitting entry and exit speed by regime
- 2008Count the run, then confirm the pivot at a channel edge