1996issue C041-4
Calibrating Williams %R entries in rising channels
Williams %R locates each close inside a recent high-low range and can be computed with a defined lookback. A usable buy reading is harder to locate in an upward-sloping price channel than between flat parallel boundaries, so the buy threshold is taken from lookback, channel slope, and channel height after stock selection is finished.
- Williams %R locates each close inside a recent high-low range, and a modified construction tracks a high close rather than a low close.
- A usable buy reading is harder to locate when prices travel in an upward-sloping price channel than when they oscillate between flat parallel boundaries.
- Stock selection is finished first. Williams %R is then used only to time a purchase at a low point inside an already identified uptrend.
- Lookback is set per stock. Once channel height and channel slope can be estimated, the buy threshold is taken from lookback, slope, and height.
What Williams %R measures
Williams %R locates each close inside a recent high-low range and can be computed with a defined lookback such as 15 days. Lookback is the session count used to measure that recent high-low range.
A modified construction uses close minus period low over period range so a high reading tracks a high close rather than a low close.
Why a rising price channel changes the buy reading
A usable buy reading is harder to locate when prices travel in an upward-sloping channel than when they oscillate between flat parallel boundaries.
Channel lines are drawn through congestion edges, extremes are omitted, and the lines are judged by how often price touches them. Channel slope is the daily rise of the parallel channel boundaries. Channel height is the constant vertical distance between those parallel channel lines.
Selection first, then a rule-based entry
Stock selection is finished first. Williams %R is then used only to time a purchase at a low point inside an already identified uptrend. The buy threshold is the Williams %R level that authorizes that entry.
Readings above 90% are not treated as a reliable sell rule in an uptrend because closes can remain near new highs for an extended stretch.
Lookback as a per-stock choice
Lookback is set per stock. An overly long window keeps the oscillator from reaching a useful low, while an overly short window produces many signals that precede only minor advances.
One lookback heuristic is about half the observed low-to-low cycle. When uncertain, a shorter window is preferred so brief reversals remain visible.
Buy threshold from channel slope and channel height
Once channel height and channel slope can be estimated, the buy threshold equals (r times S) divided by (H plus r times S), using the next lower even integer when the lookback r is odd. In that restatement, r is lookback, S is channel slope, and H is channel height.
In two same-height, seven-day illustrations, a steeper daily slope left a higher down-day floor (43% versus 23%).
ABII 15-day revised %R versus the 30% buy level
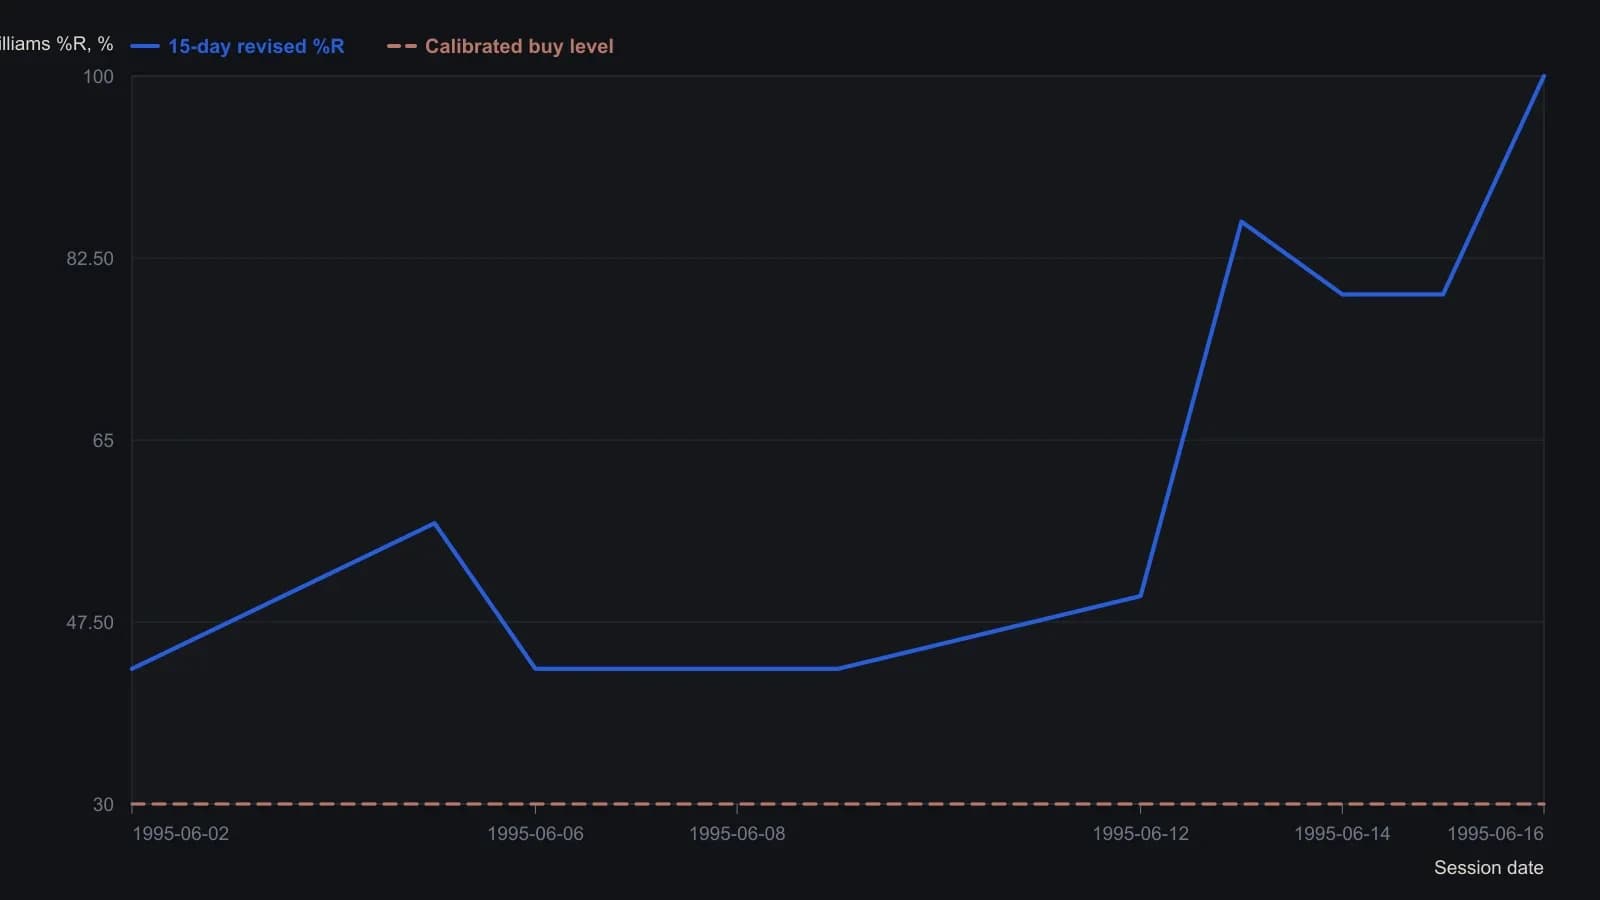
The author inverts classic Williams %R so a high reading marks a close near the 15-day high. Lookback is 15 trading days. The 30% buy line is his formula (14 × 0.10) / (3.30 + 14 × 0.10), using the next-lower even day count, a $0.10 per day channel slope, and a $3.30 channel height.
All readings on this track · 13 readings
- 1987Constructing a volume-confirmed Williams %R
- 1991Audit inverse-range oscillators before stacking stochastic %K and Williams %R
- 1991Signed midpoint range oscillator from stochastic and Williams
- 1993Confirm an intradate candlestick only after a longer cycle reprints it
- 1994Building average directional index, the stochastic pair, and Williams percent R from highs, lows, and closes
- 1994Label the tape before you read stochastic or Williams %R
- 1996Calibrating Williams %R entries in rising channels
- 1997Dynamic zones for oscillator buy and sell levels
- 1998Regression channels anchored to Williams %R turning windows
- 1999Constructing isolated synthetic waveforms to watch indicator settling
- 2000Choosing a scale for moving-average oscillators
- 2004Splitting entry and exit speed by regime
- 2008Count the run, then confirm the pivot at a channel edge