2020issue C0245
Market-order slippage on split-adjusted stock prices
Before a market-order cost or slippage model is run, the historical series has to match the cash price a live order would have faced. A stock split or dividend adjustment can rewrite earlier quotes so a current bid-ask spread applied to the split-adjusted price implies a large percentage cost that the contemporaneous fill never paid.
- After a stock split, data vendors typically rewrite earlier prices so the series does not show a gap, which changes the quotes used for cost and slippage estimates.
- A split-adjusted series can print well below one currency unit, so a past 100-share purchase can look as if it cost only a few tens of currency units when that fill never existed at the adjusted price.
- A live large-cap bid-ask near 0.01 per share is a small fraction of the unadjusted price, but the same absolute market-order slippage on an adjusted print of 0.35 implies a move of 3 percent or more just to cover the cost.
- Choosing an executable market order and measuring implementation cost requires knowing how splits and dividends were treated in the historical series.
How the price series is constructed
Algorithmic strategies can be applied to stocks, futures, foreign exchange, options, and cryptocurrencies, but each venue has distinct data and execution details that change how costs should be measured.
Three equity market-data treatments can materially distort a historical test if they are handled incorrectly, and all three concern how the price series is constructed rather than the signal itself.
What a stock split does to the quotes
A stock split is a corporate action that increases share count and lowers the quoted price. After the split, data vendors typically rewrite earlier prices so the series does not show a gap, which changes the level of the historical quotes used for cost and slippage estimates.
The split-adjusted price is a restated historical quote that removes split gaps so the series looks continuous. It is not the cash price a contemporaneous order would have paid. A split-adjusted series can print well below one currency unit, which can make a past 100-share purchase look like it cost only a few tens of currency units when that fill never existed at the adjusted price.
MSFT monthly split-adjusted prices, 1987–1991
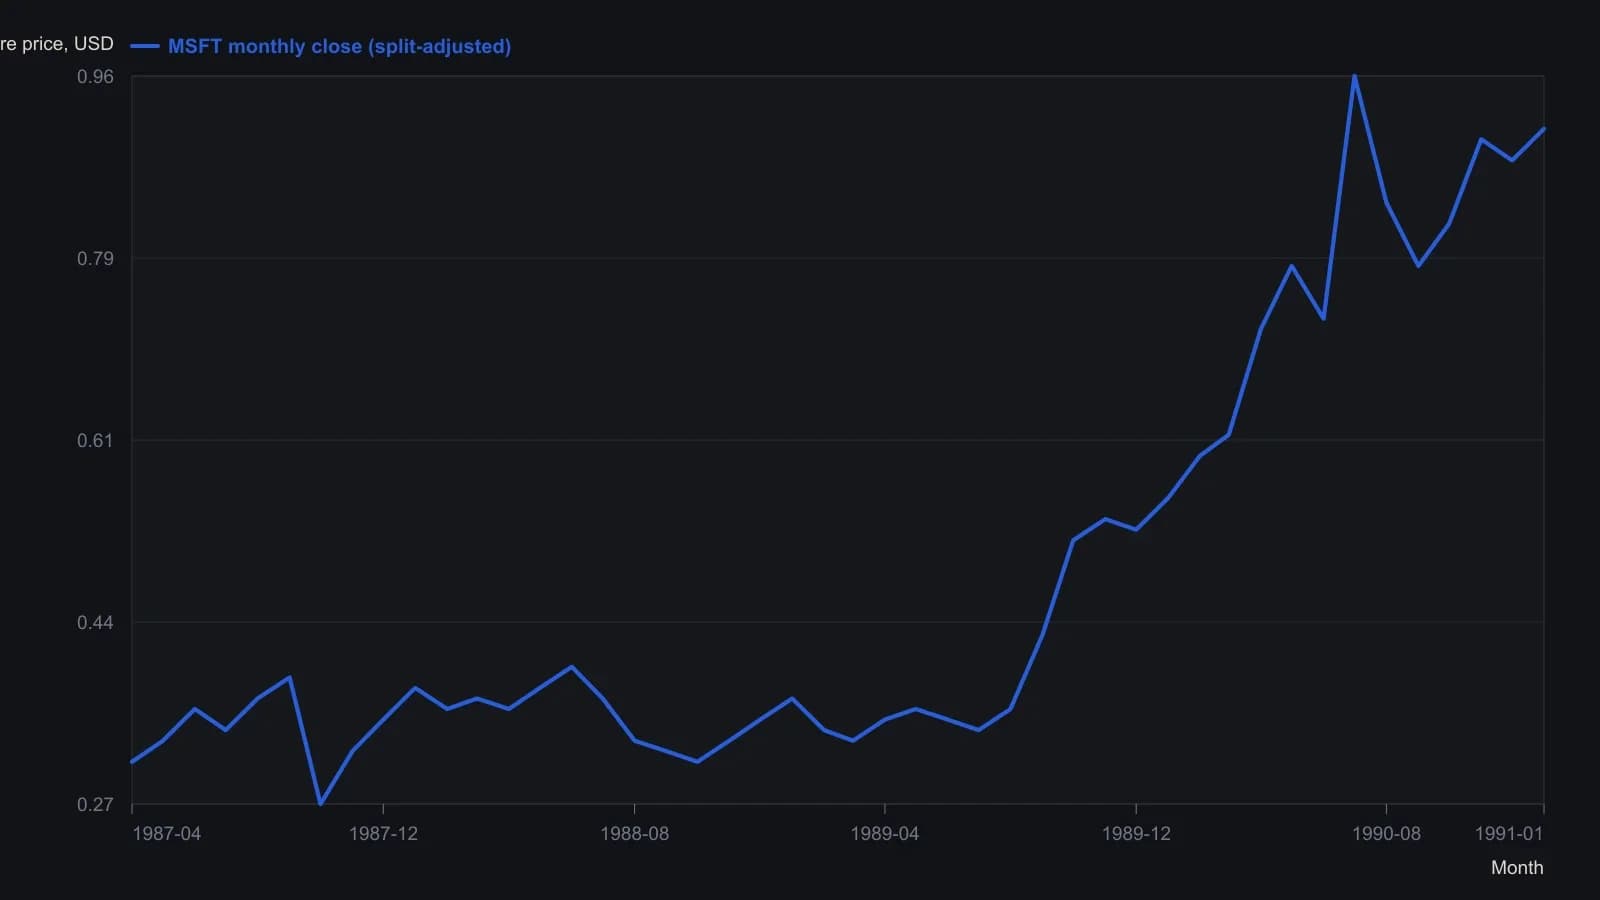
Monthly closes digitized from the plotted OHLC bars; wicks and intra-bar ranges are not carried. Values are approximate to the scale of the raster (about 0.01–0.02).
When a live bid-ask meets a split-adjusted print
A market order is an instruction to trade immediately against displayed liquidity, so the fill inherits the bid-ask spread and any slippage. The bid-ask spread is the gap between the best bid and the best offer and is a primary component of market-order implementation cost. Slippage is the difference between an assumed or decision price and the price obtained when the order is filled.
A live large-cap bid-ask near 0.01 per share is a small fraction of the unadjusted price, but applying that same absolute market-order slippage to an adjusted print of 0.35 implies a move of 3 percent or more just to cover the cost.
Dividend adjustment and the executable order
Dividend adjustments are another corporate-action rewrite that can change the historical prices fed into a transaction-cost or slippage simulation. A dividend adjustment rewrites the historical series to reflect cash distributions, which also changes the levels used in cost tests.
Choosing an executable market order and measuring implementation cost requires knowing how splits and dividends were treated in the historical series. Otherwise a cost simulation applies a current tick-size assumption to a non-tradable adjusted price. Implementation cost is the full cost of turning a signal into a fill, including spread, slippage, and other frictions over the order's life.
Commission analysis accounts for explicit fees together with implicit execution costs when judging whether a candidate fill would have been tradable. A transaction-cost and slippage simulation is a historical check that applies spread or slippage assumptions to candidate market orders before they are treated as executable.
All readings on this track · 26 readings
- 1995Canceled prints versus executable fills
- 1999How order routing changes market and limit fills
- 2000Direct access, intelligent order routing, and visible book depth
- 2001Retail routing and market versus limit fills
- 2001Stop triggers and opening-only short market orders
- 2002Market-order routing across linked venues
- 2002Market-order routing, internalization, and displayed size
- 2004Direct access order routing after the display rules
- 2004Listed-stock limit envelopes versus market-order routing
- 2005Closing option spreads with limit or market orders
- 2005Contingent routing as a pre-trade futures contract
- 2007Constructing executable futures orders with market, limit, and fill or kill
- 2008Bid-ask spreads, routing paths, and order choice
- 2008Retail market buys hit the ask
- 2008Limit versus market orders for a commodity option-spread
- 2011A pre-trade checklist before market or limit orders
- 2013Retail market orders and the displayed queue they never join
- 2013Option stop orders, wide spreads and forced market exits
- 2014Opening range breakout with weekday ratings, abstention and exits
- 2014Constructing forex orders from session liquidity
- 2015Order-type and routing scripts for faster execution
- 2015Market, limit, and routing choices inside the order life cycle
- 2015Handheld futures tickets as a second execution venue
- 2017Screen execution starts from the live bid and ask
- 2017Electronic stop-loss orders and protected price bands
- 2020Market-order slippage on split-adjusted stock prices