1992issue C041-9
A lag-regression audit of stochastic forecast skill
A historical lead-lag-sweep of daily %K against later changes in a broad exchange composite used r-squared and a slope t-statistic to separate coincident association from forecast skill.
- Daily %K from a five-day price lookback had a same-day r-squared of 0.376 against broad composite price changes, read as a moderately good coincident association rather than a lead.
- Lagging %K by one day dropped r-squared to 0.0008, and a lead-lag-sweep through 10 days stayed near zero, so the oscillator behaved as a coincident series in that sample.
- The coincident slope t-statistic was 15.34 and cleared the 99 percent large-sample threshold, while the one-day-lead t-statistic was 0.57 and did not.
- The linear setup was treated as unreliable if the true map is nonlinear, if forecasts are extrapolated outside the observed indicator range, or if the relationship itself changes over time.
What the archive tested
A stochastic-oscillator is a 0-to-100 %K series built from a short ordered-price lookback and used as the independent variable when testing whether oversold or overbought readings precede later price changes. The archive workflow computed daily %K from the prior five days of prices, kept it bounded between 0 and 100, and set it against daily changes in a broad exchange composite. The sample covered roughly 400 observations from September 1989 through March 1991.
Same-day fit is not a lead
Linear-regression is a two-variable fit of later price changes on a contemporaneous or lagged indicator, summarized by r-squared, a slope, and a fitted line that can be compared across leads. R-squared is a 0-to-1 measure of how much of the price-change variation a single linear equation attributes to the indicator at a chosen lag. A same-day linear-regression of those price changes on %K produced an r-squared of 0.376, read as a moderately good coincident association rather than a lead. The same-day fitted line was written as price change equals -2.5851 plus 0.04561 times the %K reading.
A lead-lag-sweep is a sequence of otherwise identical regressions in which the indicator is shifted one sampling interval at a time so coincident association can be separated from forecast skill. Lagging %K by one day dropped r-squared to 0.0008. The same lead scan through 10 days stayed near zero, so the oscillator behaved as a coincident series in that sample.
The slope still needs a t-test
Hypothesis-testing is a t-test that the indicator slope is not zero, formed by dividing the estimated coefficient by its standard error and comparing the result with sample-size critical values. For regressions with more than 120 observations, t-statistics above 1, 1.98, and 2.62 were presented as 67 percent, 95 percent, and 99 percent confidence that the true slope is not zero. The coincident slope t-statistic was 15.34, while the one-day-lead t-statistic was 0.57, so only the contemporaneous coefficient cleared the 99 percent threshold cited for large samples.
A monthly contrast that peaked at a lead
A contrast monthly lead sweep of a stock-price index on net changes in consumer installment debt from January 1967 through October 1987 reached its highest r-squared at a 13-month lead. Editorial reading: that contrast is included only to show that a lead-lag-sweep can retain a lag when r-squared actually peaks away from coincidence.
When the linear setup is unreliable
The linear setup was treated as unreliable if the true map is nonlinear, if forecasts are extrapolated outside the observed indicator range, or if the relationship itself changes over time.
R-squared of stock-price forecasts by months of lead
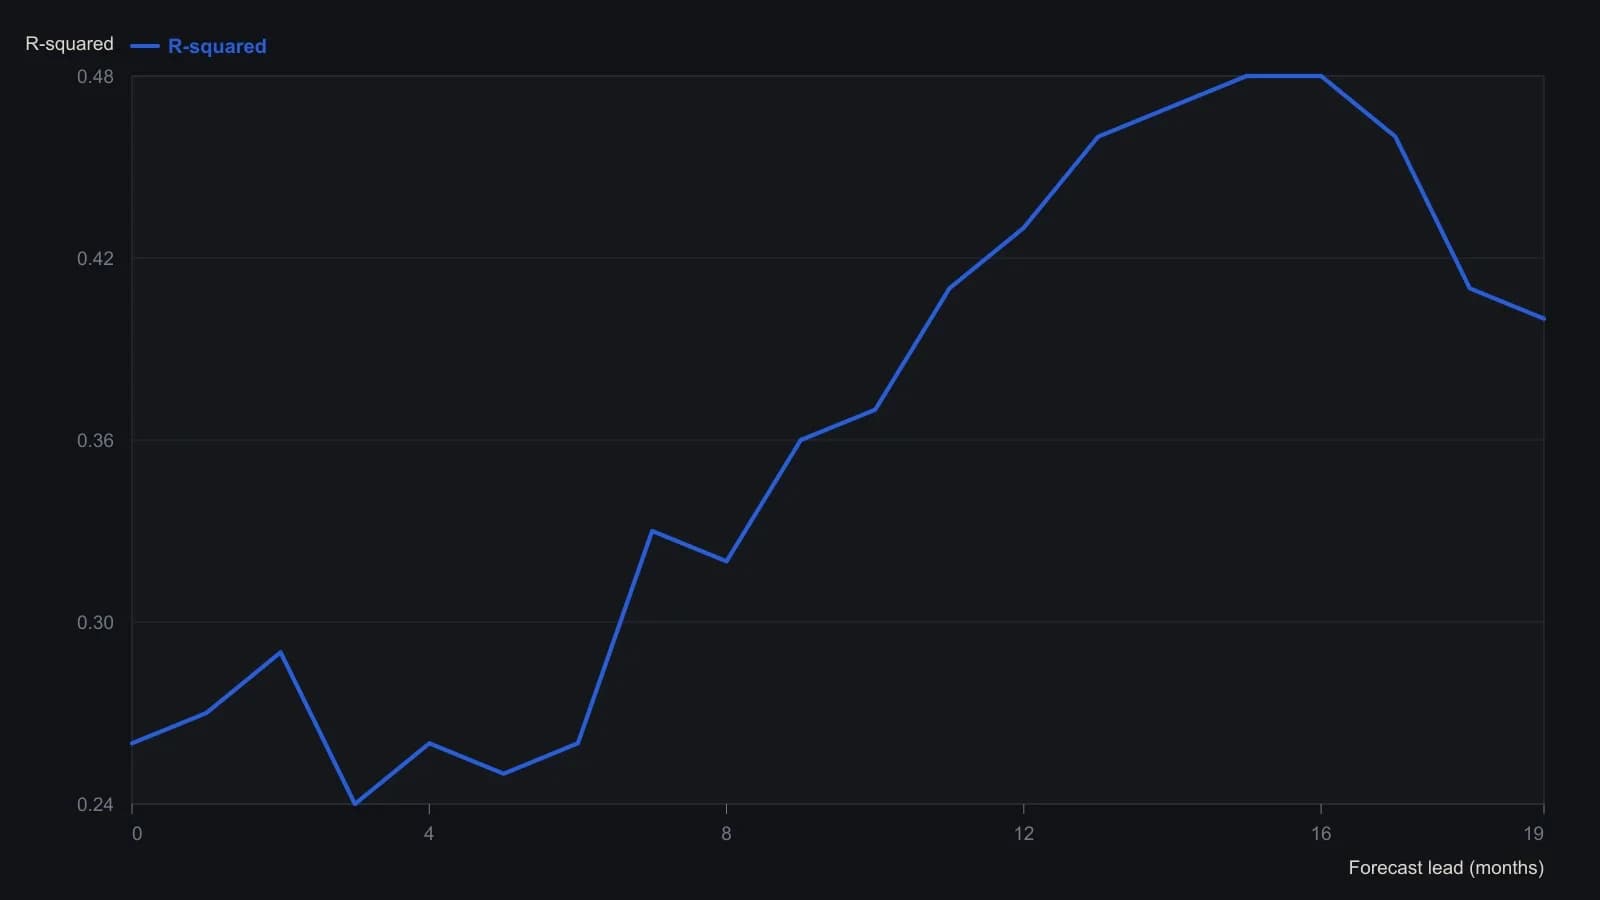
Heights were digitized from the scanned hatched bars and are only reliable to about 0.01. This is the monthly lead sweep, not the daily same-day regression the article quotes as 0.376.
All readings on this track · 20 readings
- 1988Serial dependence, trade excursions, and belief revision
- 1989Score an indicator before anyone writes a buy or sell rule
- 1990Evaluating safety labels in a crash window
- 1991Keep a decade-year only when it differs from the overall-mean
- 1991Audit indicator forecasts with chi-square hit rates
- 1992A lag-regression audit of stochastic forecast skill
- 1992Constructing detrended tests for calendar seasonality
- 1992Building a shared workbook for calendar seasonality tests
- 1995T-test evaluation of simulated trade returns
- 1995Constructing a two-proportion Z-test for hit rates
- 1996Treat a volume-price surge as a contingency table
- 1997Testing bond and stock seasonality before you trade
- 1997Walk-forward tests after system optimization
- 1997Testing breakout rate versus rally speed
- 2000Score the misses before a pattern is a system
- 2002Leave a moving-average crossover unfinished until chance cannot explain the ranges
- 2013Keep or drop an RSI threshold with a complementary-sample test
- 2013Constructing a null and a t-test for sample returns
- 2017Partial correlation and the market-adjusted stock trend
- 2017Constructing market-adjusted stock trend scores