2002issue C121-4
Leave a moving-average crossover unfinished until chance cannot explain the ranges
A chart buy stays unfinished until a same-day random draw from the same screened names cannot explain its five-day relative highs and lows. The archive sequence holds the batch fixed, marks the tape with a composite-benchmark, and promotes the condition only after the efficacy-histogram no longer looks like chance.
- Hold the stock batch and window fixed, build a composite-benchmark, compare indicator picks with a same-day random draw, and only then ask whether any gap is statistically meaningful.
- A homogeneous-universe screen exists because cheap names, thin sessions, and an already advancing tape can impersonate a high-range selector.
- Range-expansion becomes a relative-outcome only after the composite path is subtracted, and the random-baseline efficacy-histogram must sit near symmetry before it is trusted.
- The worked moving-average-crossover left only a small visual gap on that histogram, so the rule stayed unfinished.
A chart condition stays a hypothesis
Treat a moving-average-crossover as unfinished until a same-day random-baseline from the same filtered universe cannot explain its five-day relative highs and lows. The archive workflow does not promote a chart condition because the bars line up. It asks whether the later range-expansion still looks like chance.
The evaluation sequence is strict. It holds the stock batch and window fixed, builds a universe composite, compares indicator picks with a same-day random draw, and only then asks whether any gap is statistically meaningful.
Screen for a homogeneous-universe first
A candidate high-range selector was discarded after it preferred low-priced names and fired more often in unusually volatile markets. Typical percentage travel is larger in a 1-dollar name than in a 50-dollar name. Buy accuracy can also rise simply because the tape is already advancing.
One screening ideal keeps names above 20 and turning at least 100,000 shares a day. That screened set is the homogeneous-universe: names that share price and liquidity traits so cheap prints or thin sessions do not dominate the test. Robustness is claimed only after the same rule is checked across mixed market conditions rather than a single regime.
Mark the tape, then subtract it
About 490 split-adjusted names qualified on a typical day for the composite. Daily change is the log-price-change: the log of the current close divided by the prior close, which treats an equal-percentage drop and rebound as a return to the starting level. The composite-benchmark is a same-day average log change built from every name that meets the screen. It marks the tape the signal is being judged against.
For a position-style check, five days is treated as long enough to show a difference. Range-expansion is the first-day close versus the highest and lowest closes in that window. The composite path is then subtracted so a random draw should produce similar high-range and low-range distributions. What remains is the relative-outcome: a name's log range after the composite path over the same window has been subtracted, isolating selection from market drift.
Accept the random-baseline only when the plot is near symmetry
Each exploration targets at least 10,000 observations. The random five-day relative-range histogram is binned from -0.10 to 0.10 in steps of 0.0025. Near-symmetry around zero is required before that baseline is accepted. The random-baseline is a same-day draw from the filtered universe that supplies the null high-range and low-range distributions.
That paired plot of five-day high and low relative ranges is the efficacy-histogram. It should stay roughly symmetric for chance draws and should shift if the signal is doing work.
Screened-universe composite, 1996–2002
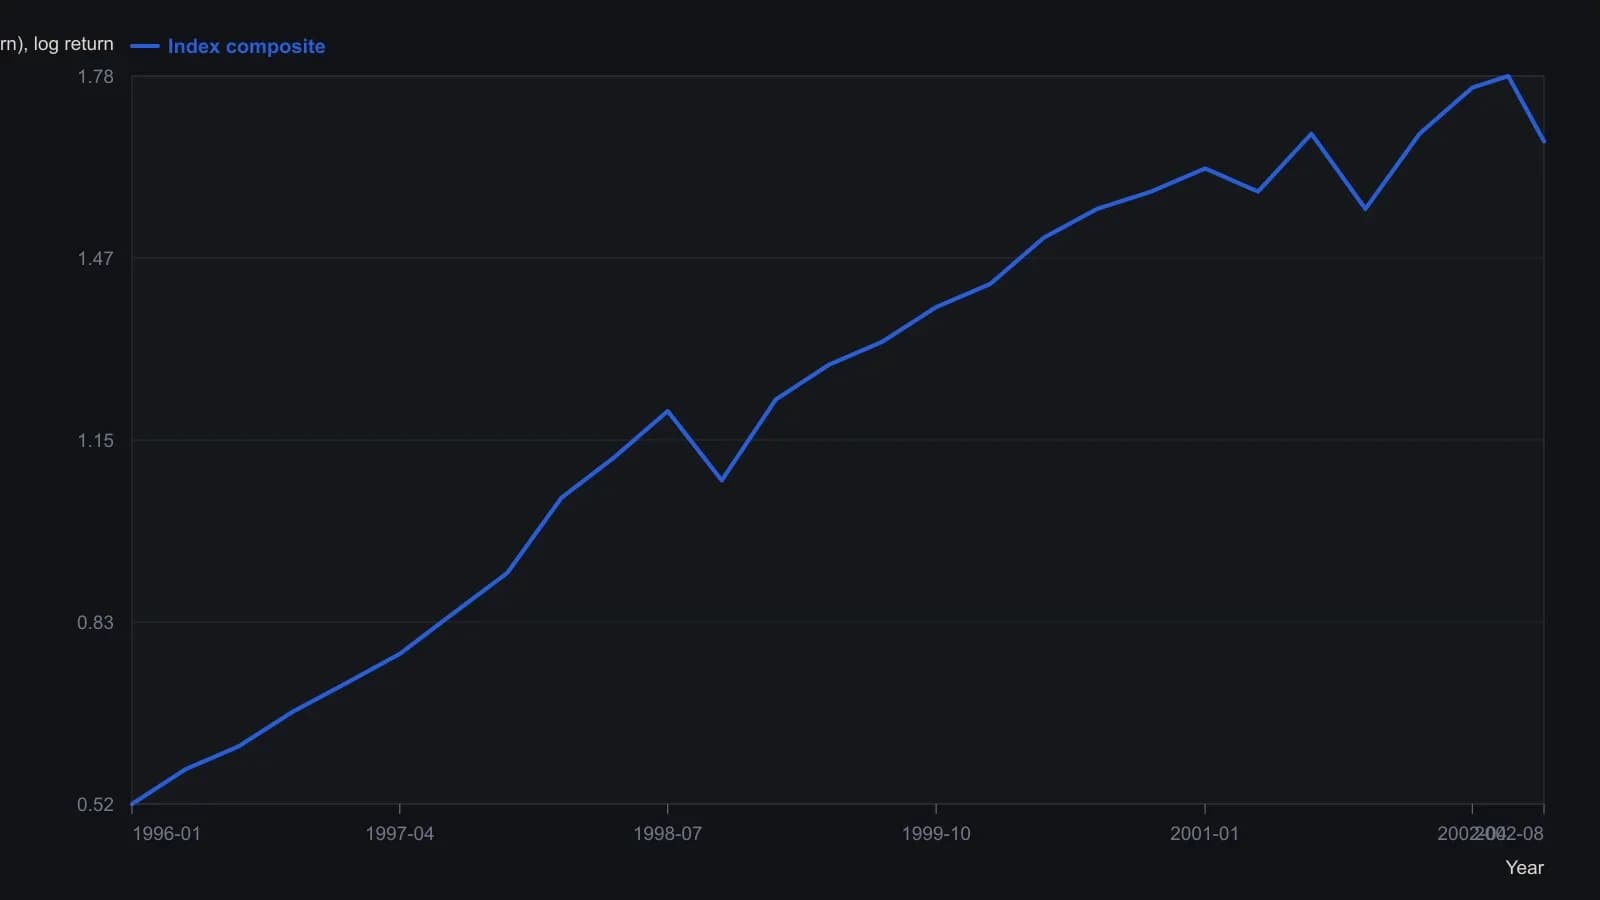
About 490 names qualified each day. The series is the cumulative average of daily log closes, not a capitalization-weighted index. Digitized from the raster, so levels are approximate except the labeled last print 1.66749.
The worked crossover left only a small gap
The worked buy rule is a moving-average-crossover that requires the close above a 2-period exponential average, that average above a 4-period average, and a cross of the 4-period average through an 8-period average, lagged five days so the subsequent window can be measured. In this check the moving-average-crossover is only the candidate rule under test: a price-structure buy condition that fires when shorter exponential averages stack and a longer average is crossed.
Overlaying that crossover sample on the random histogram produced only a small visual gap, with a slight rightward shift in the low-range series read as modest or possibly error-band downside compression. The rule was left unfinished pending longer windows, different average lengths, added volume, and a check that a small live sample still matches the histogram.
All readings on this track · 20 readings
- 1988Serial dependence, trade excursions, and belief revision
- 1989Score an indicator before anyone writes a buy or sell rule
- 1990Evaluating safety labels in a crash window
- 1991Keep a decade-year only when it differs from the overall-mean
- 1991Audit indicator forecasts with chi-square hit rates
- 1992A lag-regression audit of stochastic forecast skill
- 1992Constructing detrended tests for calendar seasonality
- 1992Building a shared workbook for calendar seasonality tests
- 1995T-test evaluation of simulated trade returns
- 1995Constructing a two-proportion Z-test for hit rates
- 1996Treat a volume-price surge as a contingency table
- 1997Testing bond and stock seasonality before you trade
- 1997Walk-forward tests after system optimization
- 1997Testing breakout rate versus rally speed
- 2000Score the misses before a pattern is a system
- 2002Leave a moving-average crossover unfinished until chance cannot explain the ranges
- 2013Keep or drop an RSI threshold with a complementary-sample test
- 2013Constructing a null and a t-test for sample returns
- 2017Partial correlation and the market-adjusted stock trend
- 2017Constructing market-adjusted stock trend scores