2013issue C0810-15
Keep or drop an RSI threshold with a complementary-sample test
A defined Relative Strength Index setup can be checked before a full trade backtest by sampling the subsequent price path and testing whether it usually moved in the intended direction. The worked hourly sample found a relative downside bias after first crosses above 70 and no relative upside bias after first crosses below 30.
- Before a full trade backtest, locate past occurrences of a defined setup, sample the subsequent price path, and test whether that path usually moved in the intended direction.
- Editorial view: treat each first 14-period RSI cross as a hypothesis that the next 14 bars differ from ordinary bars, and keep only the threshold that beats that complementary-sample test.
- On the hourly S&P 500 sample, the 14-bar test after first RSI-70 up-crosses rejected no difference in favor of a relative downside bias, while the same test after first RSI-30 down-crosses retained the no-difference null.
- The evaluation covered one specification only: 14-period RSI, hourly sampling, a 14-bar horizon, and the 30/70 thresholds, treated as parameters rather than as a finished trading system.
Evaluate the setup before a trade backtest
Before a full trade backtest, a defined setup can be evaluated by locating past occurrences, sampling the subsequent price path, and testing whether that path usually moved in the intended direction.
The first-cross rule
The Relative Strength Index used here is a 14-period oscillator of average upward versus downward closes, used to flag the first cross above 70 or below 30 as a candidate short or long setup.
The worked setup used 14-period RSI, counted only the first hourly cross above 70 or below 30, and ignored later bars until RSI left that region.
Complementary-sample tests
Hypothesis testing is a pre-specified comparison of a no-difference null with a directional-bias alternative, applied here at 95% significance to 14-bar forward percent changes after RSI crosses.
A chi-square test is a count-based check of whether subsequent prices rise versus fall after a setup at a different rate than they do in the complementary non-setup sample.
What the hourly sample showed
On the hourly S&P 500 sample dated 21 January 2013, 95.49% of bars were non-crossovers, 2.68% were first RSI crosses up through 70, and 1.82% were first RSI crosses down through 30.
Forward percent-change bands after non-crossover bars were centered near zero, while bands after the RSI-70 up-cross showed a downside tilt with the most extreme negative outcomes about twice the most extreme positive ones.
A two-sample t-test of 14-bar percent changes after RSI-70 up-crosses versus other bars produced a statistic of 2.3, above the 95% critical value of about 1.7, so the no-difference null was rejected in favor of a relative downside bias.
The same 14-bar t-test after RSI-30 down-crosses produced a negative sample mean and a statistic of -0.5, so the null of no relative upside bias was retained.
Constituent counts as reference only
Across S&P 500 constituents, 22.3% at the 95% level and 50.1% at the 75% level showed a downside bias after RSI 70, versus 8.2% and 28.4% showing an upside bias after RSI 30. Those 70-cross rates exceeded the 5% and 25% chance benchmarks, while the 30-cross rates did not. The multi-name counts were offered only as reference because the tests are designed for a single case.
One specification, not a system
The evaluation covered one specification only: 14-period RSI, hourly sampling, a 14-bar horizon, and the 30/70 thresholds. Those choices were treated as parameters that could be varied rather than as a finished trading system.
14-period RSI from the printed calculation worksheet
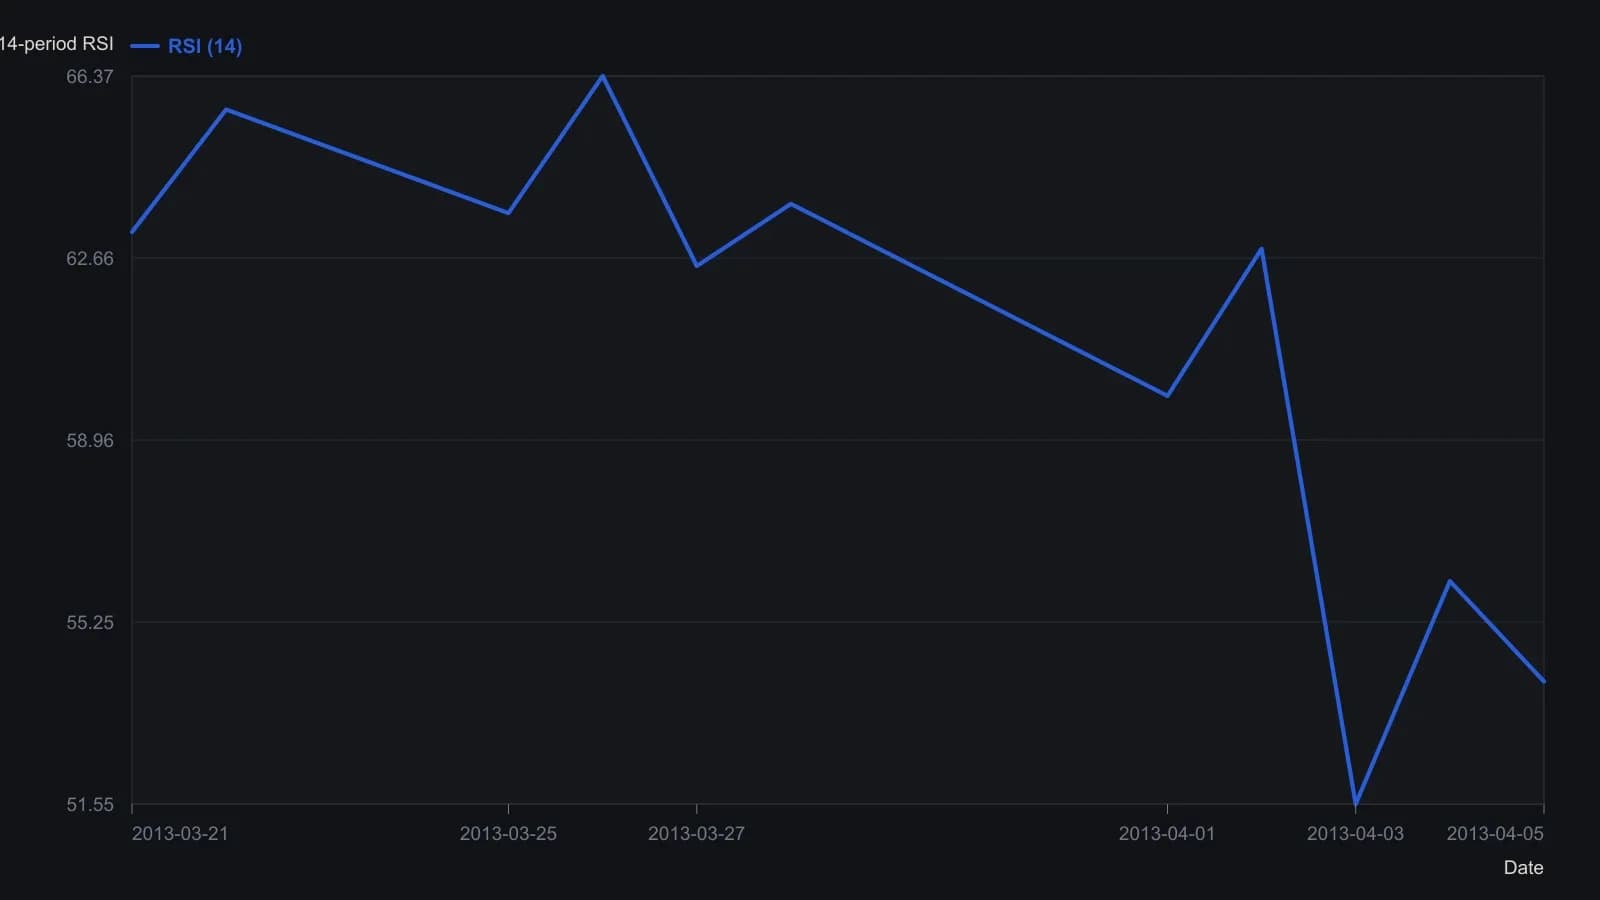
Wilder smoothing starts on 21 March 2013; earlier rows only supply gains and losses. This unnamed daily sample illustrates the formula, not the hourly S&P 500 hypothesis tests.
All readings on this track · 20 readings
- 1988Serial dependence, trade excursions, and belief revision
- 1989Score an indicator before anyone writes a buy or sell rule
- 1990Evaluating safety labels in a crash window
- 1991Keep a decade-year only when it differs from the overall-mean
- 1991Audit indicator forecasts with chi-square hit rates
- 1992A lag-regression audit of stochastic forecast skill
- 1992Constructing detrended tests for calendar seasonality
- 1992Building a shared workbook for calendar seasonality tests
- 1995T-test evaluation of simulated trade returns
- 1995Constructing a two-proportion Z-test for hit rates
- 1996Treat a volume-price surge as a contingency table
- 1997Testing bond and stock seasonality before you trade
- 1997Walk-forward tests after system optimization
- 1997Testing breakout rate versus rally speed
- 2000Score the misses before a pattern is a system
- 2002Leave a moving-average crossover unfinished until chance cannot explain the ranges
- 2013Keep or drop an RSI threshold with a complementary-sample test
- 2013Constructing a null and a t-test for sample returns
- 2017Partial correlation and the market-adjusted stock trend
- 2017Constructing market-adjusted stock trend scores