1992issue C081-7
Constructing detrended tests for calendar seasonality
Treat a popular date window as a regime hypothesis. Remove the secular drift first, compare month-bucket means with their dispersion, and keep sitting out until the same procedure can justify an entry, an exit, or continued abstention.
- Seasonality is discussable only when one period's average differs significantly from another, not when a calendar story is widely repeated.
- Raw monthly levels of a rising index fail the significance-threshold because secular drift leaves large standard deviations; year-average-normalization shrinks those deviations but still does not clear the cutoff.
- Ranking the largest and smallest calendar-column totals is not a test. The same ranking appears in tables of random digits.
- A November-to-April window that fails the screen is treated as abstention, and the construction asks for at least ten years before treating a pattern as validated.
A date is not a regime
Seasonality is a repeating calendar or other chosen cycle. It becomes discussable only after one period's average differs significantly from another, not when a calendar story is widely repeated.
Seasonal-analysis is a market-regime read that places one calendar idea against multi-month prices, residual trend, and month-bucket dispersion rather than treating the date as self-justifying.
Three matrices, one screen
The workbench is three matrices: raw monthly levels, each month as a percent of that year's average, and month-to-month percent change.
Hypothesis-testing is a predeclared comparison of period means with a baseline on ordered prices, a stated lookback, and a p-value, not a ranking of column totals. Each matrix is scored with a two-sample-t of column mean versus matrix mean. A two-sample-t is a standardized gap between a month-column mean and the full-matrix mean that uses both column and matrix dispersion and counts. A fixed polynomial then maps that T into a p-value.
Weekly buckets need a matrix about four times wider. A single global trend line can raise residual variance when the series is range-bound for years and then steepens.
Raw levels inherit the secular rise
In a 30-year monthly matrix of a broad equity index from 1961 to 1990, no month's average level differed significantly from any other month, because a secular rise left large standard deviations.
Detrending shrinks a long-run rise so month columns are not compared on raw levels that inherit the secular drift.
Year-average-normalization still misses the cutoff
Year-average-normalization expresses each month as a percentage of that calendar year's twelve-month mean. Dividing each month by that year's 12-month average and expressing the ratio as a percentage shrinks monthly standard deviations, but every comparison with the year average still stays above the significance-threshold.
Comparing only December with January of the same calendar year can manufacture a significant gap from leftover upward drift even when the rest of the year-normalized matrix shows no seasonal pattern.
Month-to-month changes keep an upward step
Month-to-month percentage changes still carry an overall 0.55% rise. The December-to-January step has a p-value of 0.08, and May is the only month with a negative average change, which remains insignificant.
S&P 500 month averages after year-mean normalization, 1961–1990
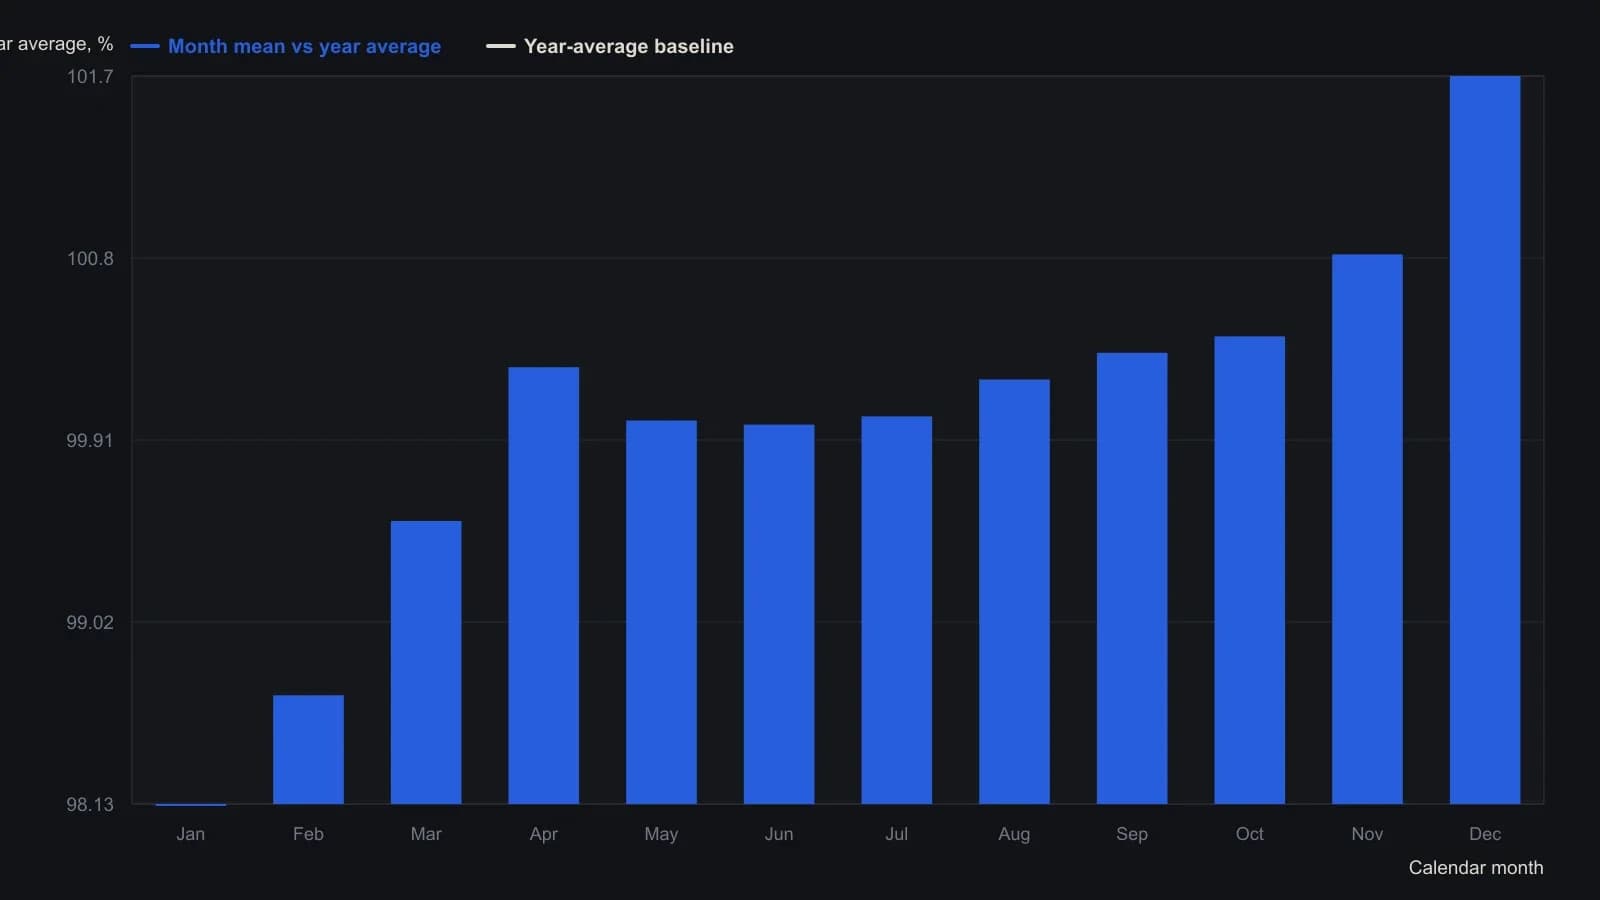
Each month's index was divided by the same calendar year's 12-month mean and written as a percent. The author preferred that local scale over a single regression because a linear or exponential fit mis-interpolated 1965–1985. Every p-value against the year average stayed above 0.05.
A failed window is abstention
A November-to-April equity window is not established as a regime in the 1961-1990 sample. November exceeded April of the same year in 18 of 30 years, and several multi-year intervals ran against the window, so a failed screen is treated as abstention rather than an entry.
Seasonal-trading is a single testable procedure that turns a calendar window into an entry, an exit, or an abstention instead of a folklore holding period.
Short slices measure how long a contrast lasts
The construction asks for at least 10 years, or an equally long column, before treating a pattern as validated. Pattern-duration is the observation that a genuine seasonal contrast can fade, so a short sample may hint at how long it lasts while remaining too small to validate it. Three- or five-year slices may hint at how long a contrast lasts but are usually too small for the significance screen to accept a pattern.
All readings on this track · 20 readings
- 1988Serial dependence, trade excursions, and belief revision
- 1989Score an indicator before anyone writes a buy or sell rule
- 1990Evaluating safety labels in a crash window
- 1991Keep a decade-year only when it differs from the overall-mean
- 1991Audit indicator forecasts with chi-square hit rates
- 1992A lag-regression audit of stochastic forecast skill
- 1992Constructing detrended tests for calendar seasonality
- 1992Building a shared workbook for calendar seasonality tests
- 1995T-test evaluation of simulated trade returns
- 1995Constructing a two-proportion Z-test for hit rates
- 1996Treat a volume-price surge as a contingency table
- 1997Testing bond and stock seasonality before you trade
- 1997Walk-forward tests after system optimization
- 1997Testing breakout rate versus rally speed
- 2000Score the misses before a pattern is a system
- 2002Leave a moving-average crossover unfinished until chance cannot explain the ranges
- 2013Keep or drop an RSI threshold with a complementary-sample test
- 2013Constructing a null and a t-test for sample returns
- 2017Partial correlation and the market-adjusted stock trend
- 2017Constructing market-adjusted stock trend scores