1997issue C091-4
Testing breakout rate versus rally speed
A 10-period moving-average channel turned reactionary highs and lows into completed break and rally segments, then compared their average rate of change on daily and weekly Treasury bond futures. The two horizons split, and both gaps were treated as too small to prove a natural speed bias.
- A 10-period moving-average channel of highs and lows located reactionary turning points that started and stopped later break and rally segments.
- Rate of change was the price change of each completed break or rally divided by that segment's length in days or weeks, then averaged separately for all breaks and all rallies.
- Daily Treasury bond futures slightly favored faster breaks, while weekly observations slightly favored faster rallies, and both gaps were treated as too small to prove a natural speed bias.
- The idea that markets naturally break faster than they rally was treated as a testable claim that had to be shown in the bond sample before later selloffs could be dismissed as trend-neutral.
A channel that closes a breakout
A 10-period moving-average channel of highs and lows was used to locate reactionary turning points that start and stop later break and rally segments. The moving-average channel is a 10-period average of highs paired with a 10-period average of lows, used to confirm that a turn has been completed.
A reactionary high is the highest close recorded while price stayed above the average of lows, marked once price later closes below that average. A breakout is the decline that begins at that reactionary high and ends when price closes below the lower bound of the moving-average channel. A break from a high therefore ran from the reactionary high until a close below the moving average of lows.
A reactionary low is the lowest close recorded while price stayed below the average of highs, marked once price later closes above that average. A rally from a low ran from the reactionary low until a close above the moving average of highs.
Rate of change as a two-horizon test
Segment rate of change was the price change of each completed break or rally divided by the number of days or weeks in that segment. Those segment rates were then averaged separately for all breaks and all rallies.
The idea that markets naturally break faster than they rally was treated as a testable claim. Hypothesis testing, in this workflow, is a comparison of average break speed with average rally speed against a no-bias baseline on daily and weekly samples. That claim had to be shown in the bond sample before it could dismiss later selloffs as trend-neutral.
Daily and weekly averages
On daily Treasury bond futures observations, 214 breaks from highs averaged a 15.9-tick daily decline and 214 rallies from lows averaged a 15.5-tick daily advance. A tick is the minimum price increment used in the study, equal to one thirty-second of a Treasury bond futures point.
On weekly Treasury bond futures observations, 38 breaks from highs averaged a 38.1-tick weekly decline and 38 rallies from lows averaged a 38.5-tick weekly advance.
The daily averages slightly favored faster breaks and the weekly averages slightly favored faster rallies. Both gaps were treated as too small to prove a natural speed bias.
Selected swings and one daily break
Selected 1993 to 1996 Treasury bond swings recorded larger average daily rate-of-change magnitudes on the selloffs than on the intervening advances.
In one illustrated daily break after a 117-14 high, price fell 37 ticks over nine sessions, an average of 4.11 ticks per day, before closing below the 10-day average of lows.
Four selected T-bond swing speeds after the 1993 peak
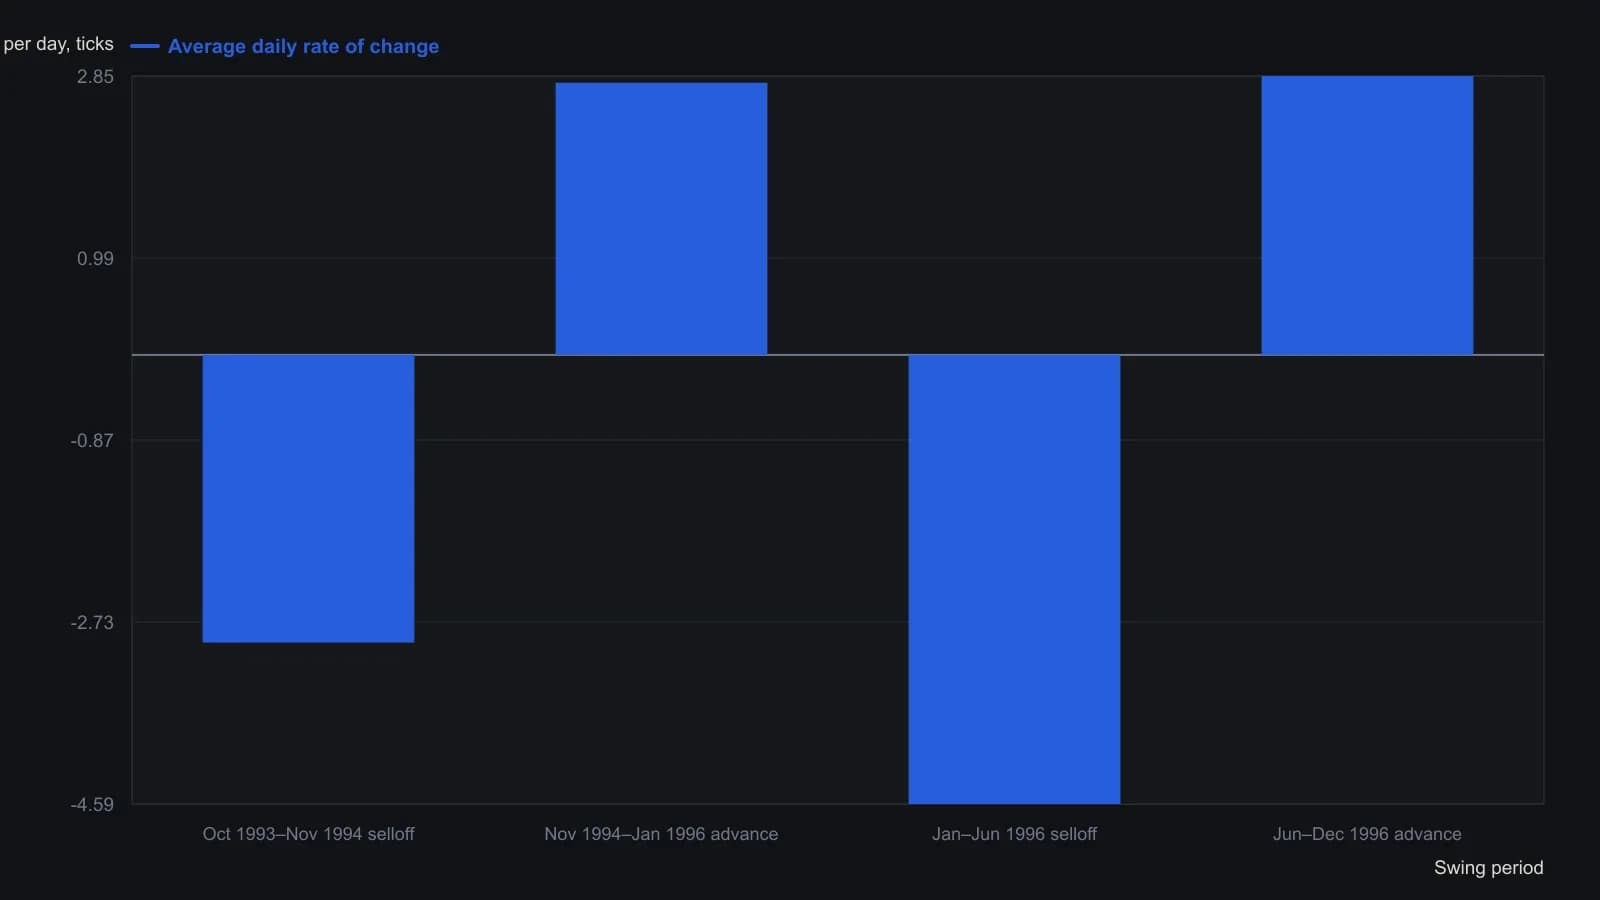
One tick is 1/32 of a point, or $31.25 per contract. Signed values keep selloffs negative and advances positive, as the article reports them.
What a split result leaves open
The archive treated the faster-break idea as a claim that must appear in the bond sample before later selloffs can be dismissed as trend-neutral. It also treated both average gaps as too small to prove a natural speed bias.
Editorial interpretation: daily means slightly favor faster breaks, weekly means slightly favor faster rallies, and the selected swings again show larger selloff rates. That mix does not retire the proverb, and it does not retire the opposing reading that later selloffs are trend rather than trend-neutral.
All readings on this track · 20 readings
- 1988Serial dependence, trade excursions, and belief revision
- 1989Score an indicator before anyone writes a buy or sell rule
- 1990Evaluating safety labels in a crash window
- 1991Keep a decade-year only when it differs from the overall-mean
- 1991Audit indicator forecasts with chi-square hit rates
- 1992A lag-regression audit of stochastic forecast skill
- 1992Constructing detrended tests for calendar seasonality
- 1992Building a shared workbook for calendar seasonality tests
- 1995T-test evaluation of simulated trade returns
- 1995Constructing a two-proportion Z-test for hit rates
- 1996Treat a volume-price surge as a contingency table
- 1997Testing bond and stock seasonality before you trade
- 1997Walk-forward tests after system optimization
- 1997Testing breakout rate versus rally speed
- 2000Score the misses before a pattern is a system
- 2002Leave a moving-average crossover unfinished until chance cannot explain the ranges
- 2013Keep or drop an RSI threshold with a complementary-sample test
- 2013Constructing a null and a t-test for sample returns
- 2017Partial correlation and the market-adjusted stock trend
- 2017Constructing market-adjusted stock trend scores