1995issue C101
Constructing a two-proportion Z-test for hit rates
A two-proportion Z-test turns two binary outcome counts into sample proportions, scales their gap by a pooled standard error of the difference, and judges the finished Z score against a conventional 5 percent critical value of 1.96.
- Build the test from two binary outcome counts by converting each pair into a sample proportion and a matching sample size.
- Form the pooled success rate as the sum of the two success counts divided by the sum of the two sample sizes, then use that shared rate to build the standard error of the difference.
- The Z score is the difference between the two sample proportions divided by that standard error, and it is judged against a conventional 5 percent critical value of 1.96.
- In the worked construction, 8 successes in 15 trials versus 41 successes in 113 trials produced a Z score of 1.276, which did not meet the 1.96 threshold.
What the test is built to ask
A two-proportion Z-test is a constructed hypothesis test that asks whether two observed success rates differ by more than sampling variation.
The test is built from two binary outcome counts by converting each pair into a sample proportion and a matching sample size. A sample proportion is the success count in one series divided by that series trial count.
How the score is assembled
The pooled success rate used in the test is the sum of the two success counts divided by the sum of the two sample sizes. That combined figure is the shared rate inside the standard error.
The standard error of the difference is the square root of the pooled rate times one minus that rate, first divided by each sample size and then added.
The Z score equals the difference between the two sample proportions divided by that standard error. The finished Z score is judged against a conventional 5 percent critical value of 1.96. That critical value is the alpha threshold used to decide whether the constructed score is large enough to reject a no-difference baseline.
A worked construction
In the worked construction, 8 successes in 15 trials versus 41 successes in 113 trials produced a Z score of 1.276, which did not meet the 1.96 threshold.
Two CTA hit rates versus the pooled proportion
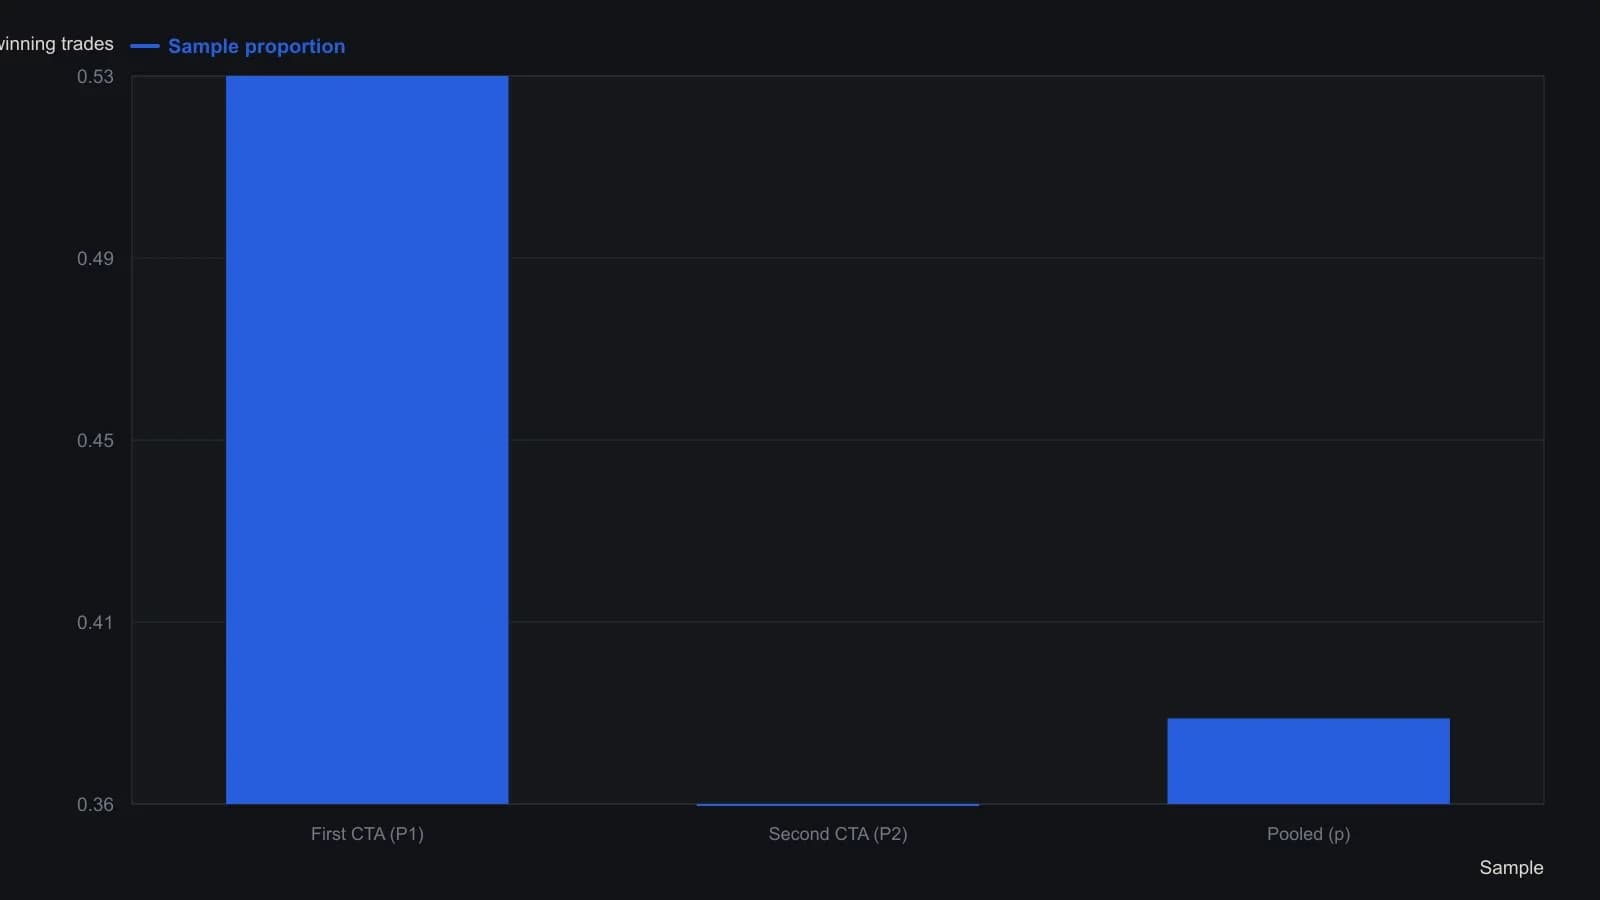
The same worksheet gives Z = 1.276, below the printed 5 percent critical value of 1.96, so the source marks the difference not statistically significant.
All readings on this track · 20 readings
- 1988Serial dependence, trade excursions, and belief revision
- 1989Score an indicator before anyone writes a buy or sell rule
- 1990Evaluating safety labels in a crash window
- 1991Keep a decade-year only when it differs from the overall-mean
- 1991Audit indicator forecasts with chi-square hit rates
- 1992A lag-regression audit of stochastic forecast skill
- 1992Constructing detrended tests for calendar seasonality
- 1992Building a shared workbook for calendar seasonality tests
- 1995T-test evaluation of simulated trade returns
- 1995Constructing a two-proportion Z-test for hit rates
- 1996Treat a volume-price surge as a contingency table
- 1997Testing bond and stock seasonality before you trade
- 1997Walk-forward tests after system optimization
- 1997Testing breakout rate versus rally speed
- 2000Score the misses before a pattern is a system
- 2002Leave a moving-average crossover unfinished until chance cannot explain the ranges
- 2013Keep or drop an RSI threshold with a complementary-sample test
- 2013Constructing a null and a t-test for sample returns
- 2017Partial correlation and the market-adjusted stock trend
- 2017Constructing market-adjusted stock trend scores