1991issue C051-4
Audit indicator forecasts with chi-square hit rates
When weekly indicators disagree, confirmation bias favors the calls that already match a prior stance. A forecast log, five horizon scores, and a chi-square test of right versus wrong counts give each indicator a scored record instead of an informal reading.
- A mixed indicator panel invites confirmation bias, because analysts tend to overweight the signals that already match their own stance.
- A weekly forecast log records each indicator as bullish, bearish, or undecided, and accuracy is scored only on later index direction, not on the size of the move.
- The same forecast week receives five horizon scores, so an indicator can post a higher batting average on short horizons than on long ones, or the reverse.
- Undecided weeks drop out of the batting average, and a one-degree-of-freedom chi-square test with a Yates correction asks whether the right-wrong split is distinguishable from chance.
Mixed signals and confirmation bias
An indicator panel is typically mixed at any one moment. Some calls read bullish, others bearish, and some sit in the middle as undecided.
Analysts tend to overweight the signals that already match their own stance. That habit is confirmation bias: the tendency to trust whichever indicators already match a prior bullish or bearish stance.
Build a weekly forecast log
One evaluation design keeps a forecast log for each indicator. Every week for 10 years, the call is recorded as bullish, bearish, or undecided.
Accuracy is scored only on the later direction of a benchmark equity index, not on the size of the move. The log tracks whether later direction agreed with a resolved call, not how far the index traveled.
Score the same week at five horizons
The same forecast week is paired with five later directional outcomes. Those horizon scores are one week, four weeks, 13 weeks, 26 weeks, and one year.
The procedure produces five separate batting averages. An indicator can score better on short horizons than on long ones, or the reverse.
Count only resolved weeks
A batting average uses only resolved weeks. An undecided week is a forecast that is neither bullish nor bearish and is dropped from the batting-average denominator.
Successful and unsuccessful cases then sum to 100 percent. The batting average is the share of correct directional forecasts among weeks that were not logged as undecided.
Test the right-wrong split
Right and wrong counts are tested with a chi-square statistic that has one degree of freedom and a Yates correction. The chi-square test is that one-degree-of-freedom significance check applied to an indicator's right versus wrong directional counts.
The Yates correction is a continuity adjustment used when the chi-square statistic is computed from those counts. Hypothesis testing asks whether an observed batting average is distinguishable from chance rather than a product of sampling noise.
The chi-square result is read as a range that indicates whether the observed right-wrong split can be treated as significant.
Chi-square gates for one degree of freedom
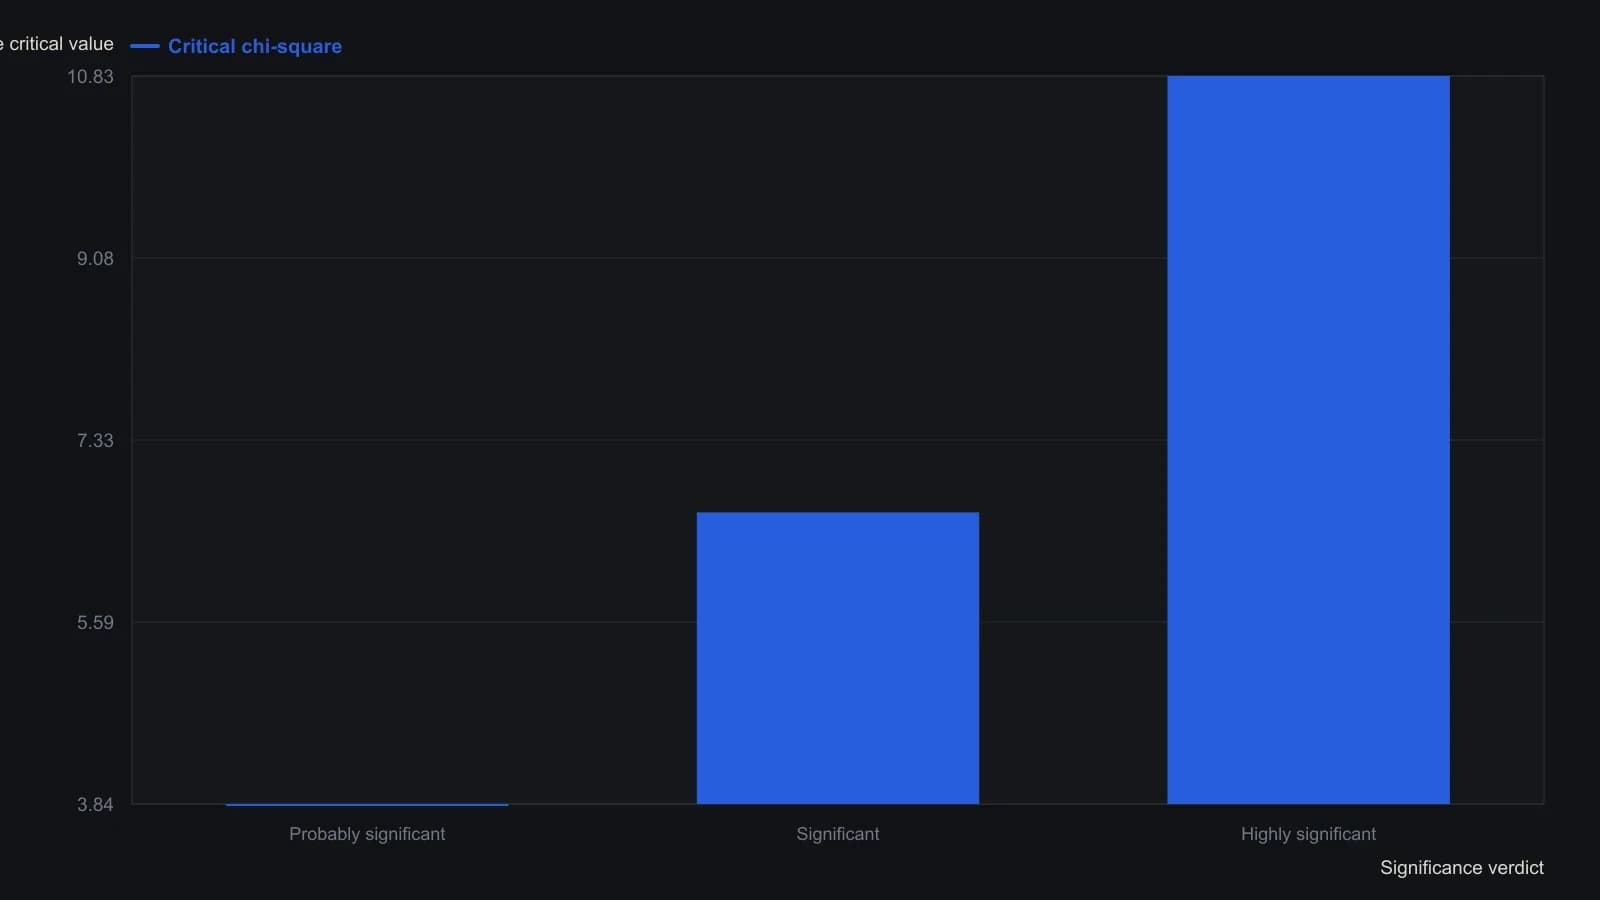
The companion formula uses one degree of freedom and the Yates correction of subtracting 1 from the absolute right-minus-wrong gap before squaring.
All readings on this track · 20 readings
- 1988Serial dependence, trade excursions, and belief revision
- 1989Score an indicator before anyone writes a buy or sell rule
- 1990Evaluating safety labels in a crash window
- 1991Keep a decade-year only when it differs from the overall-mean
- 1991Audit indicator forecasts with chi-square hit rates
- 1992A lag-regression audit of stochastic forecast skill
- 1992Constructing detrended tests for calendar seasonality
- 1992Building a shared workbook for calendar seasonality tests
- 1995T-test evaluation of simulated trade returns
- 1995Constructing a two-proportion Z-test for hit rates
- 1996Treat a volume-price surge as a contingency table
- 1997Testing bond and stock seasonality before you trade
- 1997Walk-forward tests after system optimization
- 1997Testing breakout rate versus rally speed
- 2000Score the misses before a pattern is a system
- 2002Leave a moving-average crossover unfinished until chance cannot explain the ranges
- 2013Keep or drop an RSI threshold with a complementary-sample test
- 2013Constructing a null and a t-test for sample returns
- 2017Partial correlation and the market-adjusted stock trend
- 2017Constructing market-adjusted stock trend scores