2019issue C1314-19
Inspect execution cost and margin bounds before cycle timing
A late-2018 broker comparison table listed advertised online stock commissions from no separate ticket charge at one firm to $6.95 at others, and advertised margin-loan rates from 3.56% to 9.00%. A long-cycle overlay on the S&P 500 was offered only as an approximate yearly guide. In editorial terms, that overlay is a reason to inspect implementation cost and margin bounds first, not a reason to size a position more aggressively.
- A late-2018 broker table listed standard online stock commissions from no separate ticket charge at one firm to $6.95 at others, with options priced as a base ticket plus a per-contract add-on.
- The same table showed advertised margin-loan rates from 3.56% at one firm to 9.00% at another, using website pricing as of 15 January 2018, and warned that pricing could change without notice.
- Commission figures were averages of client commissions for trades executed in December 2018, subject to published minimums and maximums, and some firms could add, reduce, or waive fees by account activity or total account value.
- The cycle overlay was an approximate yearly guide that treated an October 2018 fifth-wave top as caution, not a precise date. Editorial reading: use that caution to inspect commission and margin bounds, not to enlarge size.
What the comparison listed
A late-2018 broker comparison table listed standard online stock commissions ranging from no separate ticket charge at one firm to $6.95 at others. Options were priced as a base ticket plus a per-contract add-on. The same table showed advertised margin-loan rates from 3.56% at one firm to 9.00% at another. Those margin-loan figures used website pricing as of 15 January 2018 and noted that pricing could change without notice.
How commission figures were described
Commission figures in the comparison were described as averages of client commissions for trades executed in December 2018. They were subject to published minimums and maximums. Some firms could add, reduce, or waive fees depending on account activity or total account value. Commission analysis is the filter used to choose an executable order and account for implementation cost after those ticket, add-on, and possible waiver terms are counted.
Margin rates and the published warning
That warning sat beside the advertised margin-loan range. Margin management is the companion filter: keep a loss or exposure decision bounded before a trade is placed, and keep that bound in view throughout the position.
Advertised US margin-loan rates at a $300,000 debit
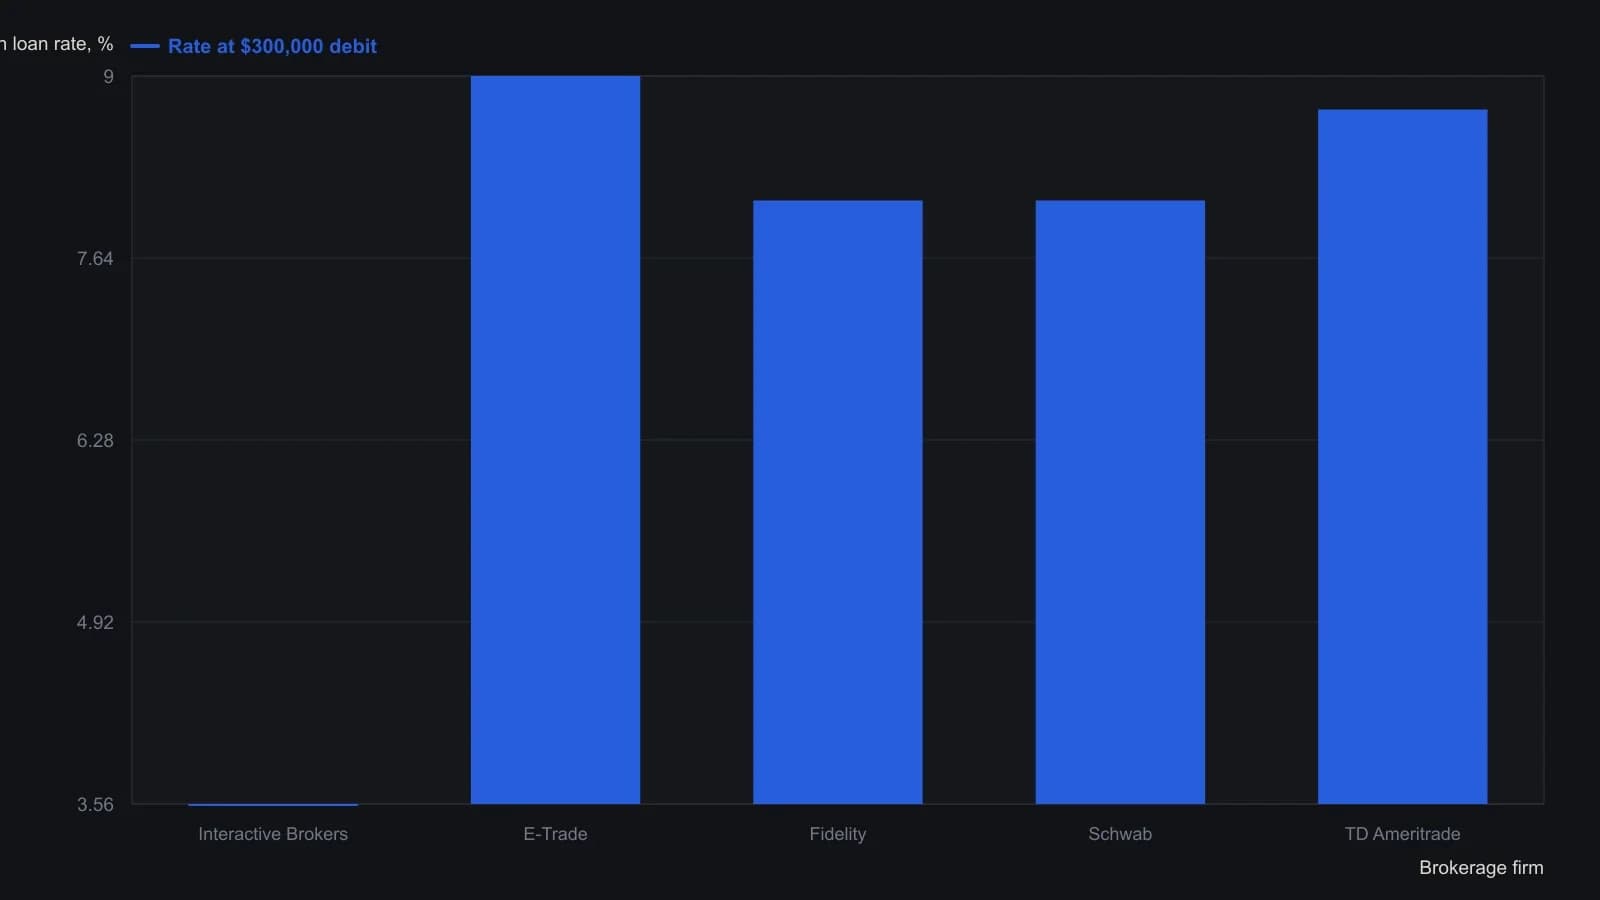
Interactive Brokers' 3.56 percent is the table's $300,000 tier; the advertisement notes that IB applies different rates by interest-rate tier. Other firms' figures are standard online pricing from their websites as of 15 January 2018. All were stated as subject to change.
The overlay as an approximate yearly guide
A long-cycle overlay on the S&P 500 was presented as only an approximate yearly guide. A correction labeled for 1999 arrived in March 2000. A bottom labeled for 2005 arrived in October 2002. A 2016 high-value sell window appeared a year earlier as a fourth-wave correction.
The cycle overlay called for a major correction to begin in 2019. The accompanying price count placed a fifth-wave top in October 2018 and treated that proximity as a reason for caution rather than as a precise date. Observed bottoms in the overlay tended to arrive two to four years before the cycle chart's labeled bottom year, which was used to place a possible low in a 2019 to 2021 window rather than in 2023.
An earlier 2018 outlook that combined the same long-cycle and wave frameworks had already framed that year as one requiring caution and close watching. A correction was then underway when the later piece was written.
Editorial reading of the overlay
This is a TradersWeek editorial reading, not a claim made by the archive. Treat the long-horizon cycle overlay as a reason to inspect execution cost and margin bounds first. Do not treat it as a signal to size a position more aggressively. The archive presented the overlay as an approximate guide and used the October 2018 price-count proximity as caution. It did not present that overlay as an instruction to increase exposure.
All readings on this track · 25 readings
- 1988When action-seeking replaces the decision process
- 1997Convert a market story into a testable decision process
- 2004Posted margin as the scarce input of an option-income write
- 2004Capping futures leverage to intended share exposure
- 2005Currency execution costs hide in spreads and margin
- 2006Daily margin as a leverage filter
- 2006A commodity sleeve is a contract-design choice
- 2007Bounding futures risk with stops, trails, and margin
- 2010Currency futures versus forex on spread, margin, and micros
- 2010Enforced margin as the real futures trade guarantee
- 2010Choose mini or standard futures before the first fill
- 2012Segregated margin is an incomplete exposure filter
- 2013Posted tickets hide margin and fill gates
- 2013Portfolio margin calls versus pair-hedge leverage locks
- 2015Forex execution checks for fills, margin, and leverage
- 2015Cheaper margin is not a currency leverage edge
- 2015Cheap daytrading margin is not a risk discount
- 2016Futures liquidity filter with equal-dollar size and effective margin
- 2016Cap futures leverage before margin turns into debt
- 2016Gold option income as a margin-sizing problem
- 2017Electronic matching changed what a futures account could carry
- 2018Broker margin-upcharges can force an option-income exit
- 2019Inspect execution cost and margin bounds before cycle timing
- 2020Treat automatic futures gearing as a pre-entry filter
- 2020Equal-dollar futures liquidity and an effective margin screen