2008issue C091-3
Evaluating point-and-figure column breaks with time stops
Point-and-figure drops the calendar, so a column break is only a written entry hypothesis. The archive makes that hypothesis auditable by adding a time stop, a 13-week trend filter, and a passive hold over the same clock.
- A point-and-figure signal is a new X or O column that exceeds a prior column extreme, because the chart records only box-sized price changes and omits calendar time.
- Double-top and triple-top buys, and double-bottom and triple-bottom sells, were applied as four discrete column-break entry rules, not as complete trade plans.
- A next-session entry plus a time stop lets the same clock be compared with a passive cash-index hold, while a 13-week trend filter allows longs only above the average and shorts only below it.
- Adding the trend filter did not materially change the relative standing of the four patterns, and the evaluation treats a bare column break as incomplete on its own.
What the chart actually records
Point-and-figure is a price-only chart that plots rising boxes as X columns and falling boxes as O columns and omits calendar time. Construction records only box-sized price changes, so a signal is a new X or O column that exceeds a prior column extreme.
That event is a column-break. It is used as a discrete entry rule, not as a later chart event that also closes the trade.
Four column-break rules
A double-top buy requires a rising X column to clear the high of the previous X column. A triple-top buy requires a rising X column to clear the highest of the two preceding X columns.
A double-bottom sell requires a falling O column to print one box below the prior O-column low. A triple-bottom sell requires a falling O column to undercut the lows of the two preceding O columns.
Two ways the archive closed the trade
The historical audit applied those four column-break rules to every S&P 500 constituent from the start of the sample, or first listing, through the end of the sample.
One exit design counted a win only if price first moved a fixed distance in the signal direction and a loss if the opposite move printed first. Each pattern produced a large number of such trades.
A second design entered on the next session open and used a time stop: a forced exit after a fixed number of sessions rather than after a later chart event. The cash index path over the same holds served as a passive baseline.
The sample included a large index decline inside a mostly rising market. The write-up flags that mix as a possible bullish bias against sell signals.
The 13-week trend filter
A 13-week simple average served as a trend filter. Long column-breaks were taken only above it and short column-breaks only below it.
Adding that trend filter did not materially change the relative standing of the four patterns versus the time-stop-only design.
How the evaluation uses the pattern
The evaluation treats a simple column break as incomplete on its own and as better used for trend context beside a separate entry rule.
Editorial reading: write the column-break as a falsifiable chart condition, then keep the exit and the higher-horizon filter as separate, testable pieces.
Average P&F trade return after a 5-, 20- or 60-day time stop
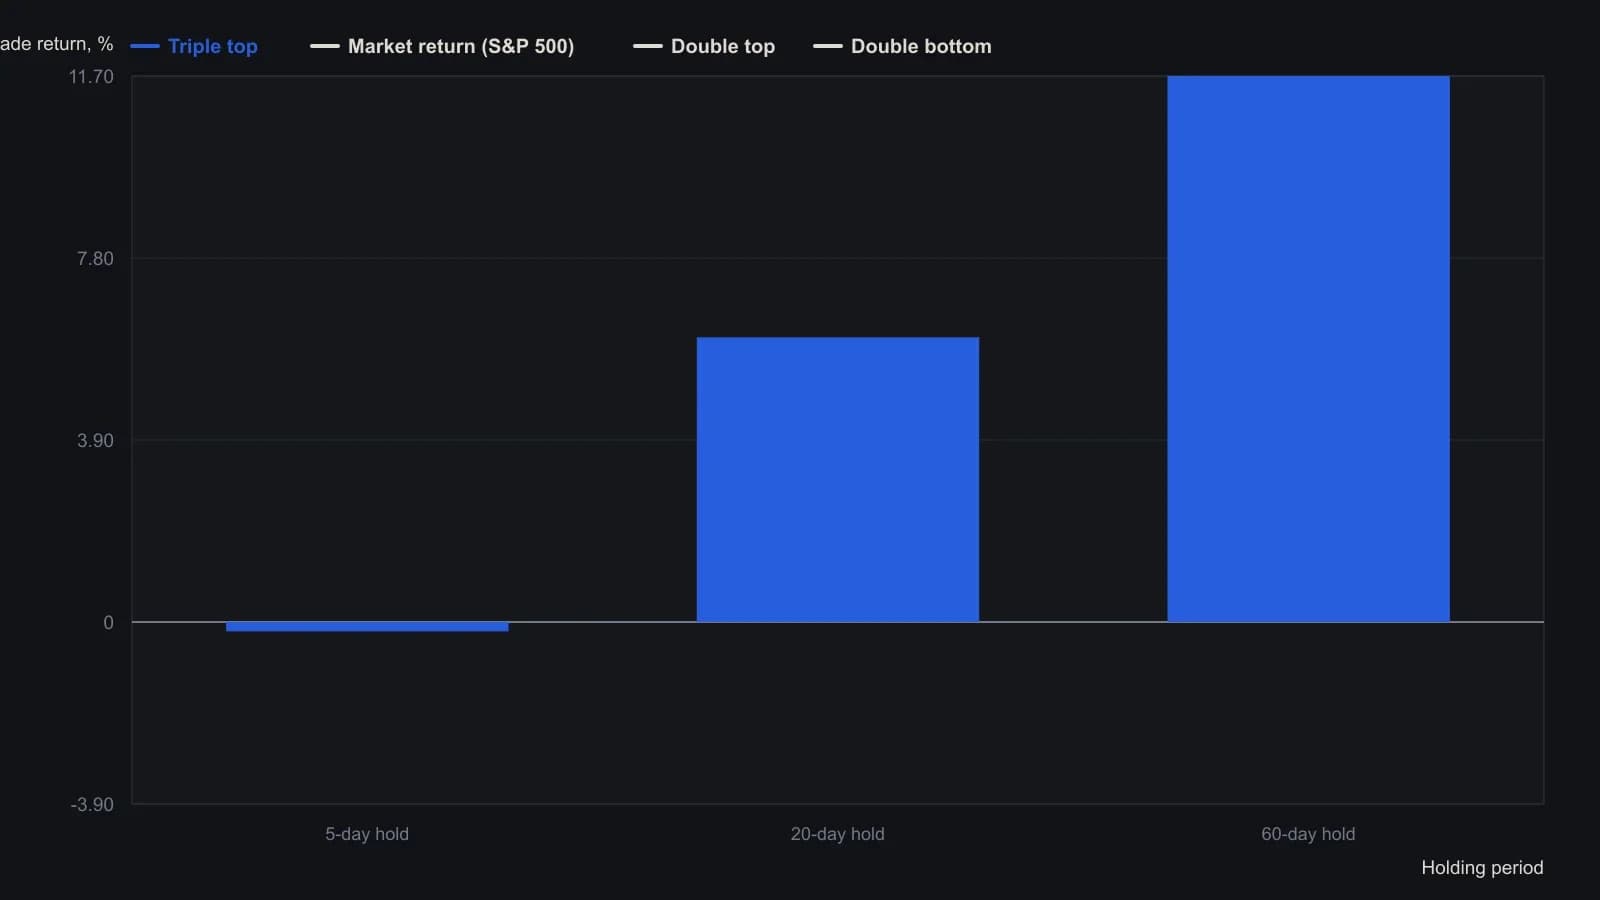
Entry is the next day’s open after the column break. The 1990–2006 window includes the 2000–02 bear market but was net bullish, a bias the author says may explain the weak sell-signal results. A separate 13-week moving-average filter left the ranking unchanged.
All readings on this track · 15 readings
- 1989Preflight checklist, time-stops, and stand-aside rules
- 1991Parameter windows for averages, option overlays and time stops
- 1995Three setup gates and a session-count clock complete a long bottom
- 1995Evaluating index futures OHLC reversals with RSI and time stops
- 1995A weekly two-close breakout and an eight-week time stop
- 2000Constructing breakout entry rules and time stops
- 2004Constructing action-reaction swing targets and time stops
- 2005Constructing breakout entries with trailing and time stops
- 2006Evaluating a restrictive range entry with a timed exit
- 2008Evaluating point-and-figure column breaks with time stops
- 2011Intraday gold swing with a daily entry limit, a time-stop, and a fixed stop-loss
- 2012Last-hour entries with a book-level loss bound and a next-open time stop
- 2015Precommit stop-loss, trailing-stop, and time-stop rules before entry
- 2018Auditing rank-rotation tests for time-stop and slot rules
- 2019Confirmation-first pyramiding with price and time stops