1990issue C031-7
Calendar windows for three-wave pullbacks
A reaction is treated as complete only when three down waves finish from a peak and the third low falls within one calendar day of a 42-, 49-, or 55-day count. The recorded cases then wait for a signal day and write a nearby stop under the prior low before the first rebound close.
- A reaction is complete only when the third down wave lands inside a 42-, 49-, or 55-day calendar-day window; two waves into day 42 remain unfinished.
- A location count to the second low and last rebound high is used to judge which of the three terminal windows is still live.
- After a window-qualified third low, the signal day is the first close one-half point above the prior high without a new low, and a nearby stop is written before entry.
- Four down waves into the same calendar count, usually on day 55, can still complete, and the final low is never a higher low.
Editorial frame
Editorial reading: treat a three-wave pullback as a dated experiment, not a named pattern. Mark the 42-, 49-, and 55-day appointments as soon as a peak prints. A case exists only if the third down wave lands inside one of those windows and a nearby stop can be written under the prior low before the first rebound close.
Editorial reading: the historical charts teach that sequence, structure first, calendar filter second, invalidation last.
When a reaction is complete
An ABC correction is a three-leg decline from a peak in which only the third down wave can complete the reaction. A two-wave pause is unfinished, and a four-wave finish into the same window can still count.
A reaction is treated as complete only when three down waves finish from a peak and the third low falls within one calendar day of a 42-, 49-, or 55-day count. Two waves down into day 42 are not a completion; a later third leg into day 55 remains possible. Four down waves into the same calendar count, usually on day 55, are still accepted.
The final low is never a higher low. A double-low shape is allowed, and the last rebound high may exceed the prior high.
Where the count may start
A double top can serve as the count origin. If identical highs span several sessions or a weekend, the count may start on whichever date produces a valid calendar landing when the three-wave shape is already clear. A February start can finish one day short of the usual one-day tolerance.
Calendar-day windows and location counts
A calendar-day window is one of the three dated targets measured from the peak, plus one day either side, where a third-wave low is allowed to complete. The three terminal windows are described as about equally common.
A location count is an intermediate day count to the second low and last rebound high, used to judge which of the three terminal windows is still live. A second low near days 19 to 22 often precedes a last high near days 34 to 38 and a finish near day 42. A finish near day 55 often has a second low near days 28 to 32 and a last high near days 42 to 46.
Volume and the third selling day
Each down wave often includes at least a sharp three-day selloff, with volume expanding at the lows. A short-term position is delayed until after that third selling day.
Signal day and the time stop
After a third-wave low inside a window, the recorded signal is the first close one-half point above the prior high that does not print a lower low. That session is the signal day. The case-study stop is then set about one and one-half points below the prior day's low.
A time stop is the pre-marked 42-, 49-, or 55-day calendar window that decides whether a third-wave low is on time, paired with that nearby protective stop written before entry so exposure is bounded if the rebound fails.
Four historical cases
In the Compaq case, a June 2 peak produced a second low on day 28, a last high on day 46, and a final low on day 56. Volume expanded at the June 16, June 30, and July 26 lows, and a two-point stop under the July 26 low is the recorded invalidation.
Three later cases use the same construction. Pfizer completed three down waves in 55 days from a July 1 peak to an August 25 low. Federal National Mortgage Co. counted from the February 10 side of a January 29 / February 10 double top to a March 30 1988 low on day 49. Temple-Inland fell from a February 8 1989 peak, made a second low at 21 days, and a third low on March 23 at 43 days.
Editorial note: Compaq's day-28 second low and day-46 last high sit on the path that often finishes near day 55. Temple-Inland's 21-day second low and 43-day third low sit on the path that often finishes near day 42. Pfizer lands on the 55-day window and Federal National Mortgage Co. on the 49-day window; those two cases are not given intermediate location counts.
Compaq Computer three-wave reaction, June–July 1983
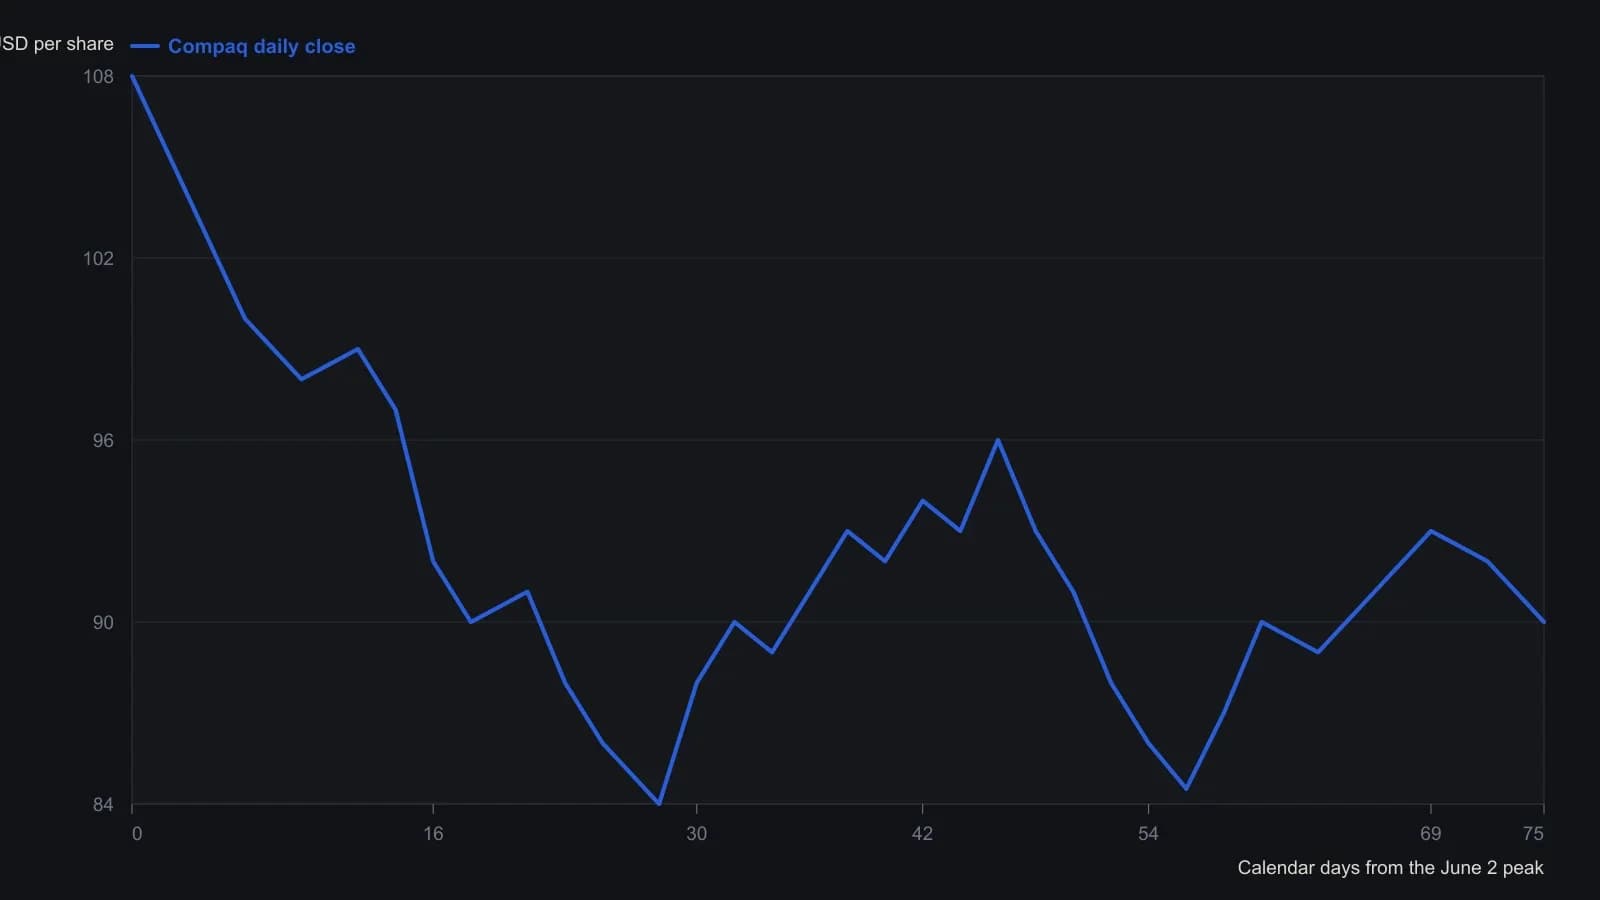
Daily closes digitized from the printed Compaq chart (Figure 1). Wave labels and the 96 to 84-1/2 last-leg range are those the article states; intermediate closes are approximate to the raster.
All readings on this track · 18 readings
- 1986Copper wave degree and channel objectives
- 1987Constructing a price-time Fibonacci window for the ABC correction
- 1989Building entry and exit rules from pivots, channels, and abc-corrections
- 1989Constructing ABC Fibonacci expansion objectives
- 1990Calendar windows for three-wave pullbacks
- 1990Labeling wave 1, B, or X after a five-wave C
- 1991Constructing an Elliott zigzag with ABC Fibonacci checkpoints
- 2002Constructing Elliott wave ABC and triangle pattern counts
- 2003A bear-market bounce as a second wave, an RSI nonconfirmation, and an ABC relabel
- 2004A pretrade risk lockbox at Elliott ABC ends
- 2005Three-check identification of an ABC pause in an uptrend
- 2005The 61.8 percent Fibonacci line as a zigzag kill-switch
- 2005Constructing volume-float channels for ABC corrections
- 2008When monthly wave counts split, freeze the ABC and Fibonacci brackets
- 2012Fiery bull construction from sector thrust to wave count
- 2013Critiquing rigid Elliott wave ratios after computerized trading
- 2018V-wave count construction from impulse and ABC corrections
- 2018Constructing short hypotheses from completed ABC corrections