1995issue C031-3
Evaluating index futures OHLC reversals with RSI and time stops
Entry-and-exit evaluation is a three-layer exam: publish an oscillator control so the mean-reverting bias is explicit, state the long as three same-session OHLC tests, and flatten on a fixed day-count so the holding period ends the hypothesis.
- Publish a relative-strength-index control before scoring candlestick-patterns so the market’s anti-trend-model bias is explicit.
- Define the long as three same-session tests: a close that outruns the open, a range-filter on the bar, and a d-day-low inside a short recent window.
- Exit only with a time-stop, then run a holding-period-scan so the same entry is scored under many fixed lives.
- Keep pattern inputs fixed and arbitrary, and treat a buy on the next session’s close as the baseline against listed timing variants.
A three-layer exam
The evaluation question is not whether a chart shape looks like a reversal. It is whether an entry-and-exit rule can be examined as three published layers: an oscillator control, a same-session long trigger, and a calendar exit that ends every trade.
Editorial reading: the first layer makes the market’s mean-reverting bias explicit. The second layer turns candlestick-patterns into three falsifiable open-high-low-close tests. The third layer lets the holding period, not a price target or a trailing stop, decide when the hypothesis is over.
Publish the oscillator control
The relative-strength-index is a bounded momentum oscillator scaled from 0 to 100 and sampled over a fixed lookback. Threshold crosses supply the anti-trend control against which the pattern is compared.
The published control treated a drop below the lower threshold followed by a rise back through that threshold as a long, and a rise above the upper threshold followed by a fall back through that threshold as a short.
That oscillator rule was applied to a continuous equity-index futures series, with an initial stop and a per-trade allowance for slippage and commissions.
The same market was described as rarely persisting in one direction for many days and as a setting where anti-trend-model constructions were expected to fare better than trend-following ones.
Editorial reading: publishing this control first is what makes later pattern scores interpretable. Without it, a long reversal sits in an unnamed regime.
State the long trigger as three checks
The mechanical long trigger is built from the same session’s open, high, low and close plus a short lookback for an extreme low, so a repeatable chart shape becomes a testable entry.
The long-only reversal required three checks on the signal session. The close had to exceed the open by more than a stated point threshold. The high-low range had to clear a range-filter. A d-day-low had to sit inside the most recent several sessions.
When those three checks were met, the baseline entry was a buy on the next session’s close. Fills on the next open, a tick offset above the next high, or the signal-day close were listed as variants.
Pattern inputs were held fixed and labeled arbitrary rather than optimized. Both continuous and rollover contracts were used.
Editorial reading: the three checks are the whole long hypothesis. They do not add a confirmation oscillator at entry. The relative-strength-index stays in the control layer.
Retire every trade on a day-count
The reported pattern test used a time-stop as the only exit: flatten on the close after a chosen number of sessions, so exposure ends on the calendar rather than on a price target.
A holding-period-scan then swept calendar exits across a stated band of day-counts so the same entry could be scored under many fixed lives. The detailed long-only case used one pre-chosen session close.
Editorial reading: a time-stop keeps the exit from becoming a second, unstated price rule. The scan shows whether the same three-check entry changes character as the allowed life lengthens. It is not a search for a new exit.
A complete write-up therefore names the relative-strength-index control, the three same-session checks that arm candlestick-patterns, and the time-stop that ends the trade.
September 1990 S&P futures: V-bottom long and timed exit
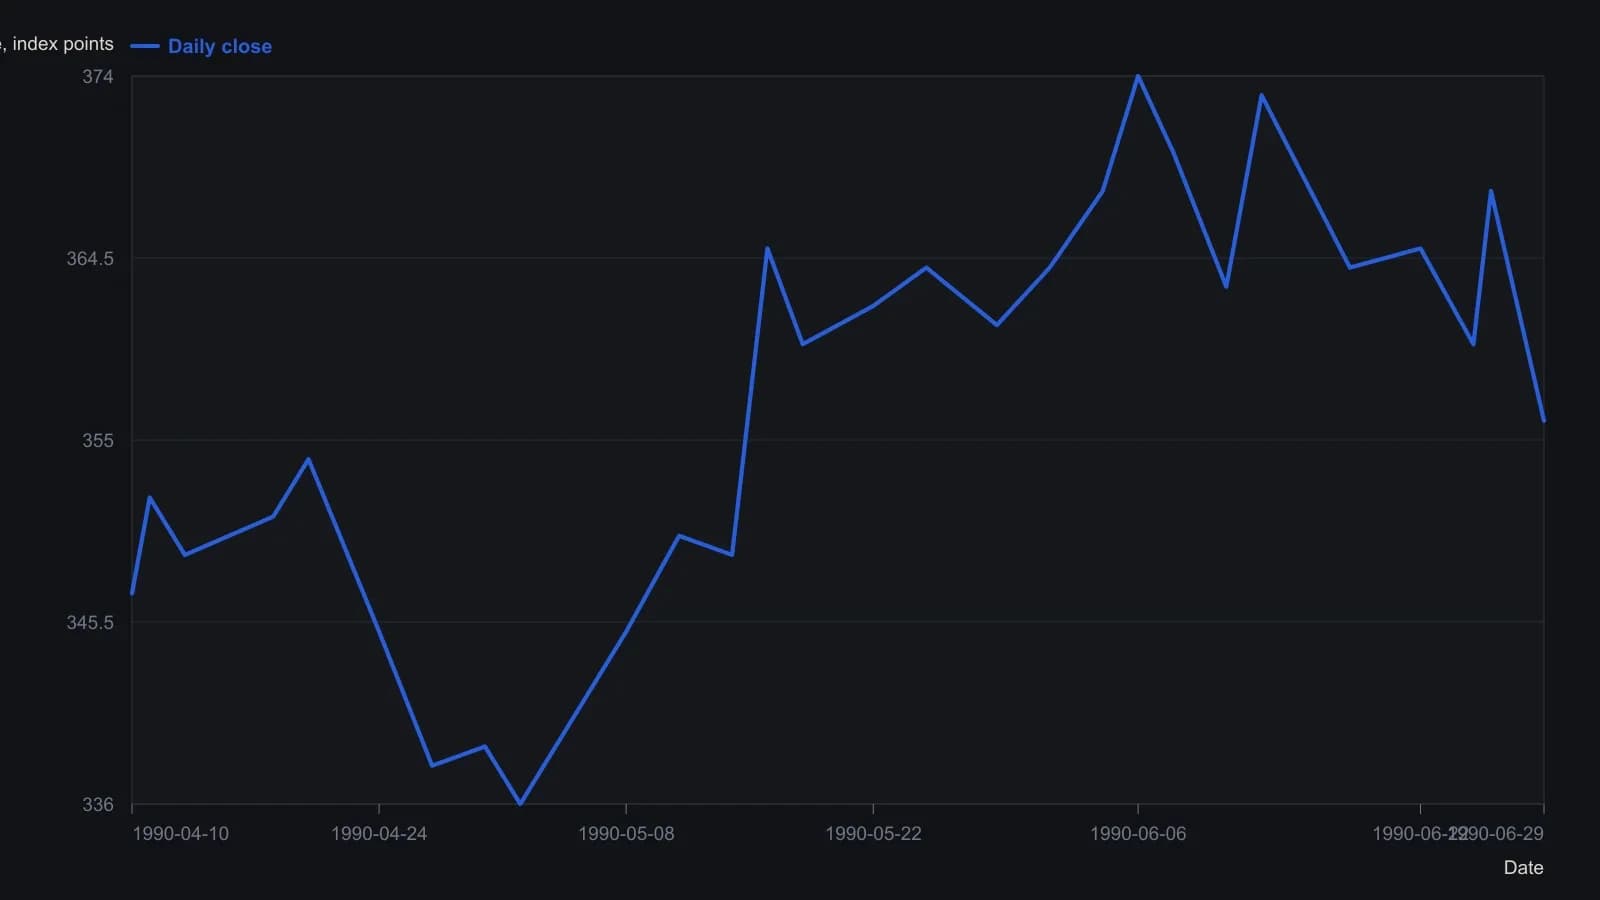
Digitized from a 5-point price grid on the printed daily bar chart; expect about one index point of reading error. The window header quote of 311.50 on 20 September is a later contract print, not a bar in this April–June window.
All readings on this track · 15 readings
- 1989Preflight checklist, time-stops, and stand-aside rules
- 1991Parameter windows for averages, option overlays and time stops
- 1995Three setup gates and a session-count clock complete a long bottom
- 1995Evaluating index futures OHLC reversals with RSI and time stops
- 1995A weekly two-close breakout and an eight-week time stop
- 2000Constructing breakout entry rules and time stops
- 2004Constructing action-reaction swing targets and time stops
- 2005Constructing breakout entries with trailing and time stops
- 2006Evaluating a restrictive range entry with a timed exit
- 2008Evaluating point-and-figure column breaks with time stops
- 2011Intraday gold swing with a daily entry limit, a time-stop, and a fixed stop-loss
- 2012Last-hour entries with a book-level loss bound and a next-open time stop
- 2015Precommit stop-loss, trailing-stop, and time-stop rules before entry
- 2018Auditing rank-rotation tests for time-stop and slot rules
- 2019Confirmation-first pyramiding with price and time stops