2011issue C1227-34
How an adjustable-bands z-test resizes the no-trade zone
A fixed Bollinger-style z-score treats the interior of the bands as a range, no-trade zone, but one lookback cannot be known as optimal before the sample. This article shows how an efficacy ratio resizes the moving average and the bands so the no-trade zone itself is the main construction choice.
- The baseline z-score is current price minus the moving average, divided by the standard deviation, so a reading above 1 sits above the upper one-deviation band and a reading below -1 sits below the lower band.
- The fixed-parameter version uses a conventional 21-day moving average and standard deviation and treats the interior of the bands as a range, no-trade zone.
- The adjustable-bands z-test keeps the same long, short, and flat band rules while resizing the moving average and the deviation with an efficacy ratio.
- A larger efficacy reading is intended to suppress some short-term whipsaws in a range, and a smaller reading is intended to allow an earlier entry in a trend.
The baseline z-score and the fixed bands
The baseline z-score is current price minus the moving average, divided by the standard deviation. A reading above 1 sits above the upper one-deviation band. A reading below -1 sits below the lower band. That z-score of price versus a moving average and standard deviation is used as the band location and the signal trigger.
The fixed-parameter version uses a conventional 21-day moving average and standard deviation. Bollinger bands here are an envelope around that moving average at plus or minus one standard deviation. The interior of the bands is treated as a no-trade zone: range action, and therefore not a signal region.
The construction problem
The construction problem the adjustable version targets is the mismatch of applying a trending rule in a range. That mismatch shows up as delayed entries, sideways whipsaws, and parameters that cannot be known as optimal before the sample.
How the adjustable-bands z-test is built
The adjustable-bands z-test keeps the same band rules. It goes long above the upper deviation band, short below the lower band, and stays flat inside. After the bands have been resized, the rule set still buys above the upper band, sells below the lower band, and stays flat between the bands.
What changes is the moving average. It is an adaptive lookback average whose length is lengthened or shortened by the efficacy ratio. The same ratio resizes the deviation that sets the band width.
The efficacy ratio
The efficacy ratio is the 34-day standard deviation divided by the six-day standard deviation. A larger reading lengthens the average and widens the bands. A smaller reading shortens both.
In a ranging tape the larger efficacy reading is intended to suppress some short-term whipsaws. In a trending tape the smaller reading is intended to allow an earlier entry.
Stated construction targets
The design also aims to reduce lag in trends, widen the prohibited interior when the market is ranging, and keep the lookbacks aligned with the prevailing major move.
Stated construction targets include adaptive averages and deviations, a long-window pair to skip some range noise, a short-window pair to join a new trend sooner, and automatic switching via the efficacy ratio.
Historical sample and the location statistic
The study series is daily Kuala Lumpur Composite Index futures from 15 December 1995 through 31 December 2008. The series uses close plus open, high, low, and volume, with additional robustness checks planned on other futures.
Observed Fkli uptrends and downtrends in the sample sit at or near the Bollinger envelope. That is why the z-score of price versus that envelope is used as the location statistic.
Abz' envelope around FKLI through 2008
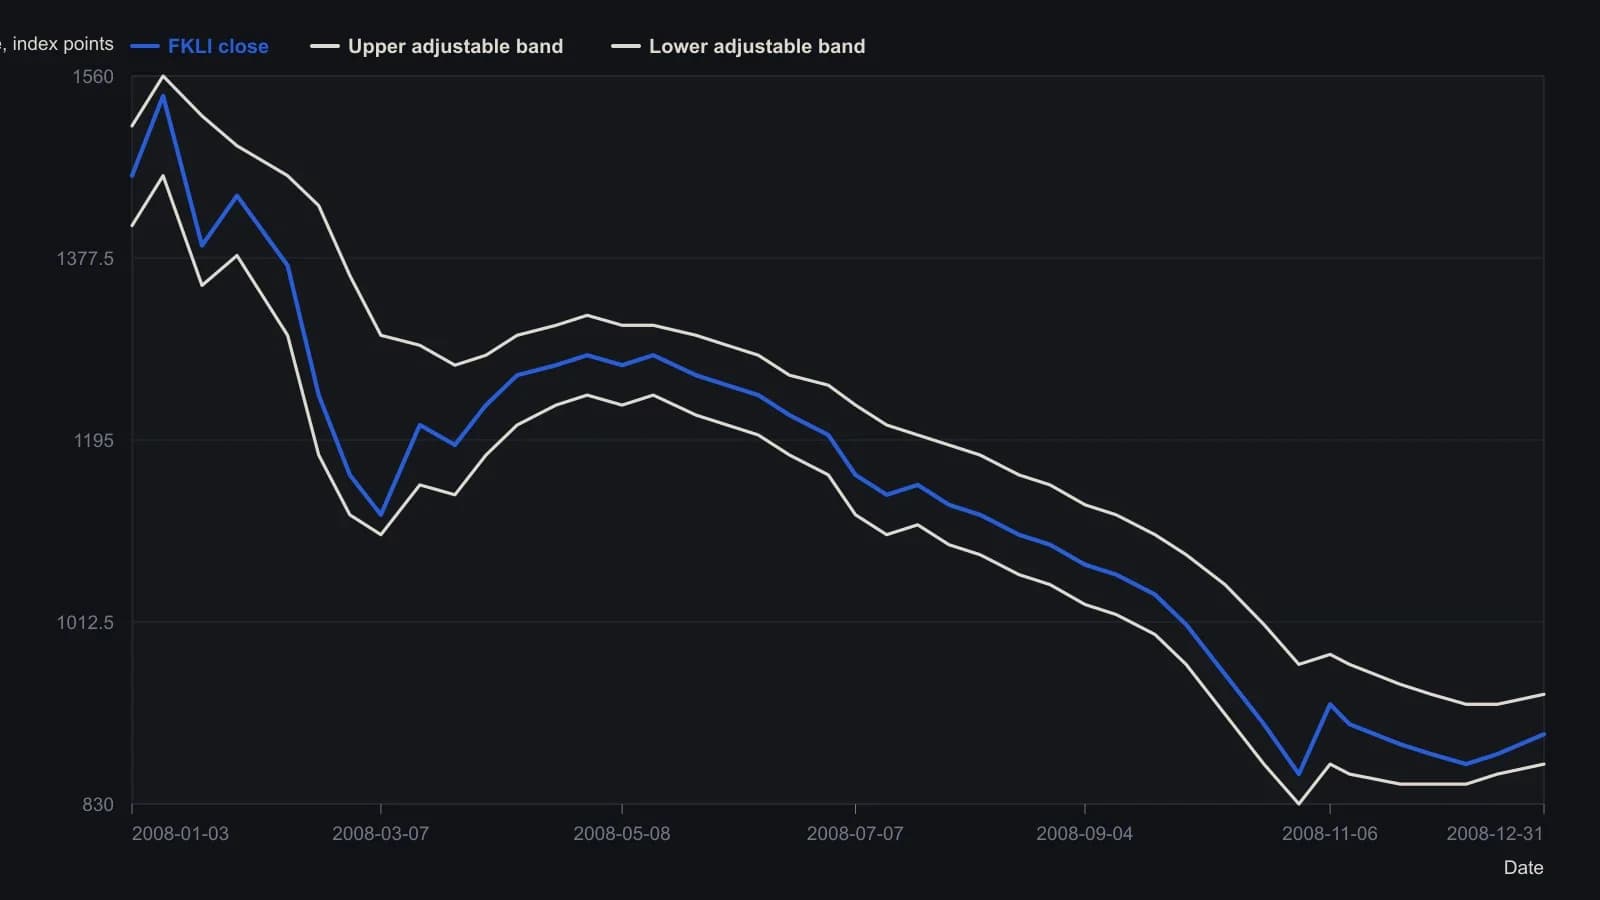
Readings are approximate; the magazine figure does not print a numerical series. Abz' sets moving-average length and band width with a 34-day over 6-day efficacy ratio and treats the interior inside about 0.8 standard deviation as the no-trade zone.
All readings on this track · 11 readings
- 1991Constructing standardized sentiment trend filters
- 1995Market z-score residuals for style pair construction
- 1995Constructing scaled z-score normalization for model inputs
- 1996Normalize price and volume onto a common scale
- 2001Constructing pair spreads with z-score triggers
- 2003Rebuilding band distance as a z-score crossover
- 2003Constructing price z-scores with dual averages and bands
- 2003Zigzag target zones from a normalized deviation oscillator
- 2005Constructing a z-score scored range-breakout filter
- 2006Constructing a trend system from Bollinger Bands and z-scores
- 2011How an adjustable-bands z-test resizes the no-trade zone