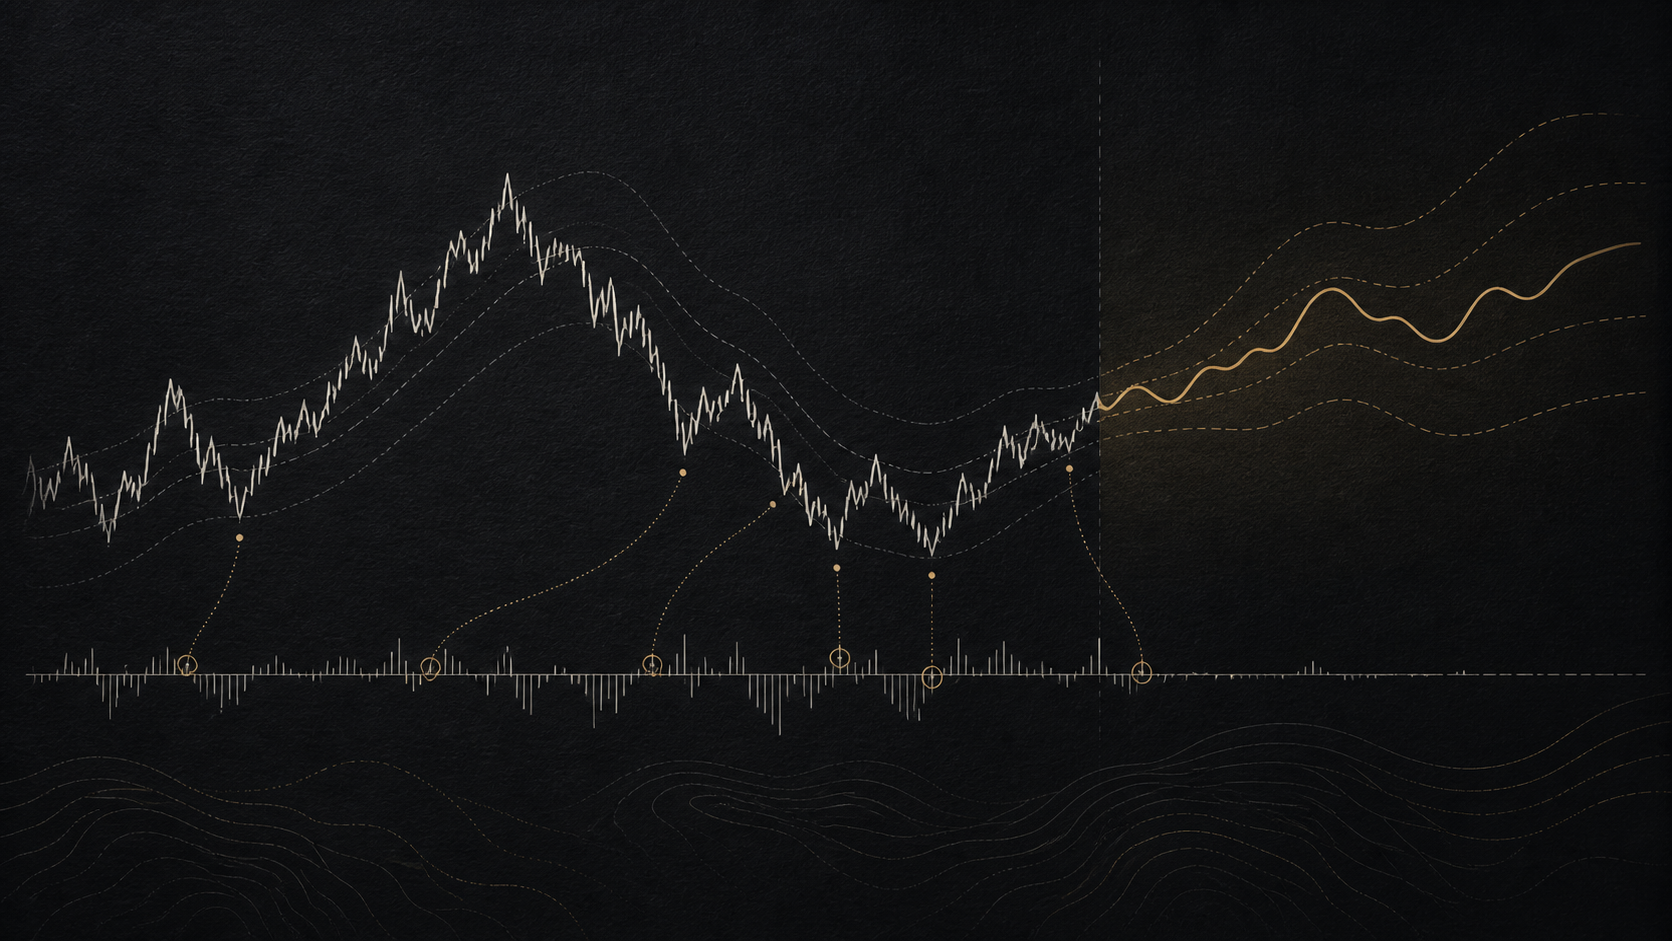
Methodology
Cumulative delta, divergence, and when it is noise
Cumulative volume delta is a running sum of one number: for every bar, the volume that bought at the ask minus the volume that sold into the bid. It answers a single question — which side kept crossing the spread — and it is routinely asked to answer a different one, which is where most of the frustration with it comes from. CVD does not show that there were more buyers than sellers; every trade has both. It shows which of them was impatient. Price rising while CVD falls is not a contradiction to be resolved, it is a recognised condition: passive orders absorbing aggression. This page covers how the series is built, how divergence is read, and the cases where the reading stops being evidence.
How the series is built
CVD sits one step downstream of the footprint. Bar delta comes from sorting executed trades by which side crossed the spread; CVD accumulates it. The arithmetic is trivial and the two choices around it are not.
bar delta = ask volume − bid volume        (from the trade tape)
CVD[n]    = CVD[n−1] + bar delta[n]

fallback, when no trade tape exists:
buy%      = (close − low) / (high − low)
bar delta = volume × (2 × buy% − 1)
- The reset point changes the picture
- A CVD restarted at each session open and a CVD run continuously are different series drawn from the same data. Neither absolute level means anything — only the slope and the shape do. Comparing a level today against a level last week is a mistake the chart invites, because the line looks like a price.
- The fallback is a different measurement
- Where a real trade tape exists, delta is counted from it. Where it does not — spot forex, most equity feeds without tick data, any historical bar without trades attached — delta is estimated from where the candle closed inside its range, weighted by volume. That estimate is a transformation of price, so a divergence between it and price is partly a property of the formula. It is worth knowing which of the two your chart is drawing.
- Size filtering is a lens, not a fix
- Filtering out small prints before accumulating produces a cleaner-looking line on the theory that size carries the information. The counter-argument is concrete: execution algorithms split large orders into small child orders specifically so they do not stand out, so the filter removes signal along with noise. Useful as a second view, not as the corrected version of the first.
What a divergence claims
The pattern is simple to state. Price posts a higher high, CVD posts a lower high; or price posts a lower low and CVD does not follow. The claim is about effort against result: the second push happened with less aggressive participation than the first.
| Pattern | What it claims | How it fails |
|---|---|---|
| Bearish divergence | Higher high in price, lower high in CVD: the new high needed less aggressive buying than the previous one | Resolves by CVD catching up as often as by price turning. Nothing in the pattern bounds how long it can persist |
| Bullish divergence | Lower low in price, higher low in CVD: sellers pushed the price down without matching aggression behind it | Common inside strong downtrends, where passive buyers are absorbing all the way down and price keeps going |
| Absorption at a level | Heavy aggression, price refusing to move: a passive participant is taking the other side | Indistinguishable in the tape from a queue that emptied and refilled from unrelated orders. The cause is an inference |
| Higher-timeframe divergence | Price on the working timeframe against CVD on a slower one: the slower series is treated as the context | Adds a second timeframe to shop across. With enough timeframe and lookback combinations, some divergence is usually visible somewhere |
When CVD is noise
This section exists because the complaint is common and mostly correct. CVD is noisy under specific, identifiable conditions, and knowing them is more useful than a smoothing setting.
- When it is used directionally
- "CVD is rising, so buy" fails because the premise is wrong: rising CVD means buyers crossed the spread more, and the participants who move markets are frequently the ones sitting passively on the other side of that. Effort-versus-result is the question CVD can answer. Direction is not.
- When the venue is not where the action is
- A CVD built on one exchange's spot tape describes that tape. In crypto, a large share of aggressive flow is on perpetual futures, and during fast moves the perp tape can lead spot. The divergence you are looking at may be a venue difference rather than a change in participation.
- When delta is estimated rather than measured
- On any market without a public trade tape, the delta feeding CVD is derived from the candle. Divergence between a price series and a function of that same price series is a weaker claim than it looks, and chart configuration does not strengthen it.
- When the timeframe was chosen after the fact
- Divergence is defined against swing points, and swing points depend on a lookback setting. Change the lookback, get different swings, get different divergences. A divergence found by scanning settings until one appeared is a result of the search, not of the market.
- When it is asked to time an entry
- The pattern contains no clock. A divergence can hold through a move large enough to close the position that was opened on it. Traders who get use out of it treat it as a condition that raises attention on a level, and take the entry from something with a defined invalidation.
How this is implemented here
CVD is part of the same order-flow layer as the footprint, which is what supplies the delta it accumulates.
- Delta comes from the Binance spot trade tape where that tape is loaded, and falls back to the candle-shape estimate where it is not. The distinction is the one described above, and it is the reason forex CVD here is a weaker reading than crypto CVD.
- The series can be reset per session or run continuously, and rendered as a line or as candles. Session reset is the default, on the argument that the absolute level is not a quantity worth carrying across days.
- A separate view filters individual trades by size before accumulating, for the size-carries-information reading, with the caveat above.
- Divergence detection marks price-against-CVD swings on the chart and can compare the working timeframe against a slower one. Swing detection uses a lookback window, which is the setting the last limit above is about.
- CVD is one of 28 order-flow layers, Premium at $120 per month. The chart itself, the 123 indicators and automatic Elliott labeling are free without registration.
Questions people actually ask
What does CVD actually measure?
The running sum of net aggressive volume. Each bar contributes the volume that bought at the ask minus the volume that sold into the bid; CVD is those contributions added up. It measures which side kept crossing the spread, not which side accumulated a position. Every trade has a buyer and a seller, so CVD can never tell you that there were more buyers than sellers — only that buyers were the ones in a hurry.
Is CVD useful or is it mostly noise?
It is useful for one narrow job and noisy for everything else. The job is comparing effort against result: how much aggressive volume it took to move price a given distance, and whether that ratio is changing. Used that way it is informative. Used as a directional indicator — CVD up, therefore buy — it fails often enough to feel random, because price rising on falling CVD is a normal, well-understood outcome when passive orders are absorbing aggression. Most complaints that CVD is pointless come from the second usage.
How should I read CVD divergence against price?
Price makes a higher high while CVD makes a lower high, or the mirror image at a low. The honest reading is that the second push was achieved with less aggressive participation than the first, which says the move is being carried by fewer impatient participants. It is a statement about effort, not a timing signal: divergences resolve by price turning, but also by CVD catching up, and they can persist far longer than a position can. What raises its value is confluence — a divergence sitting on a level that other evidence already marked.
Why does CVD look different on another platform?
Three reasons, all of them ordinary. Reset point: CVD restarted daily and CVD run continuously are different series, and the absolute level carries no meaning in either. Venue: a single exchange tape is not the whole market, and in crypto much of the aggression is on perpetual futures rather than spot. Source of delta: some platforms derive delta from the real trade tape, others estimate it from where the candle closed inside its range. The last one produces a plausible-looking line from data that never contained an aggressor side at all.
Does CVD work on forex?
Only as an estimate. Spot forex has no consolidated trade tape, so delta cannot be measured; it is inferred, either from quote movement or from candle shape. A CVD line built that way is a transformation of price and volume, which means a divergence between it and price is partly an artefact of the transformation. It can still be worth watching, but it is not the same evidence as a CVD built from exchange trades.
What is institutional CVD?
The same running sum with small trades filtered out, on the argument that size prints carry more information than retail-sized ones. It is a useful lens and a contested one: large orders are routinely split into small child orders precisely so they do not stand out, so a size filter removes some noise and some of the signal with it.
Effort against result is easier to judge with the footprint underneath the line than with the line alone. Both sit on the same chart, and the free core opens without an account.
Open terminalLast reviewed 11 August 2026